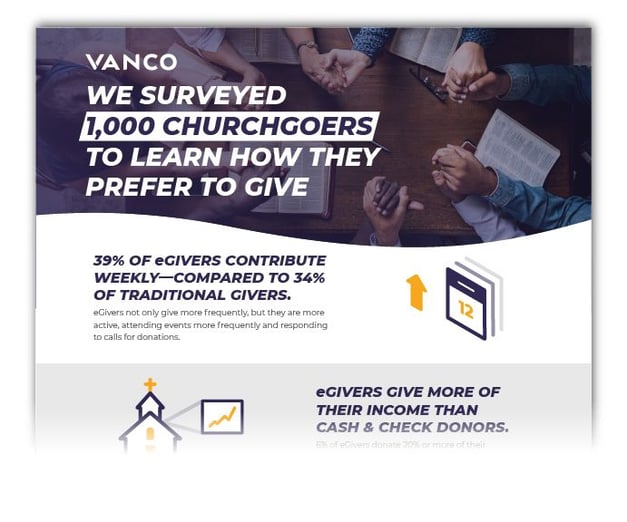
When people are approached in the way they prefer to give, they give more. That's why we interviewed 1,000 churchgoers about their giving preferences. Download the infographic to receive the data you need to improve your appeal to givers and see how you can increase donations.
Want the Full Report?
In our giving study, we uncover several surprising details, including...
- 22% of eGivers contribute to their churches two or three times a month.
- 39% of eGivers contribute weekly (compared to 34% of traditional givers).
- Among churchgoers who tithe 10% of their salaries, giving preferences are almost evenly split between eGiving (27%) and
traditional giving (28%).
- eGivers donate more of their salaries than traditional givers.
- Churchgoers ages 35-44 are 2 times as likely to give with an app compared to 24-34 year-olds.
- 37% of respondents ages 35-44 said they’d be very likely to give more to cover standard processing fees.
- 35% of churchgoers in the 35-44 age group are among the most enthusiastic about selecting a cause for their gifts.
- eGivers are more likely than traditional givers to make multiple gifts each month.
- Churchgoers want to give, pay for events and participate in fundraisers with cards and smartphones at church.
- Age is no longer the factor it was once considered when it comes to embracing eGiving. Younger members like eGiving,
but so do older age demographics.
If you want to access the full study, click the button below to get the comprehensive report.

