

Executive Summary
Perceptions and Motivations Toward Giving and eGiving
Churchgoers remain driven to give by personal faith and community impact. The most frequently cited reasons for giving include:
- Supporting the church community
- Upholding Bible-based values
- Contributing to important community work
Over time, perceptions toward eGiving have become increasingly more positive, especially among adults ages 24 to 54. Concerns such as “eGiving not being Christian” or “Contributions not reaching the church” have declined, although resistance among older adults (55–72) remains somewhat stronger.
In-person Church is Back, and Impacting Giving Behavior
Between 2021 and 2025, in-person church attendance rose from 51% to 96% in the wake of the pandemic, yet virtual participation remains meaningful — especially among younger adults. Nearly half of churchgoers still attended services online in 2024, most commonly through TV, recorded streams or online platforms.
- Weekly giving has declined slightly since 2015 (from 49% to 39%), but has bounced back to pre-pandemic levels.
- Monthly and multi-month giving is rising, particularly among 35- to 44-year-olds.
- Directed giving (designating funds to specific church needs) increased from 27% in 2015 to 31% in 2025, showcasing the desire for givers to contribute to specific causes they feel called to support.

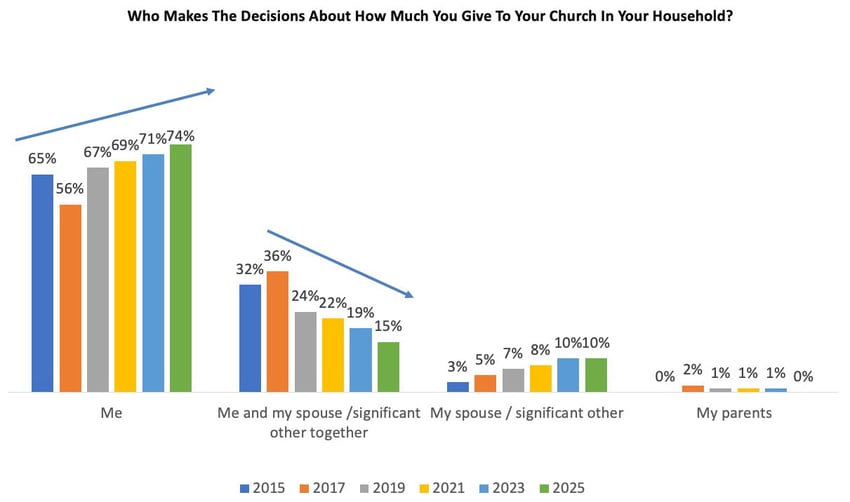
Additionally, individual giving decisions have become the norm (74%), overtaking combined spouse decisions (15%), indicating a possible move to more independent finances inside many households.
Trends in Generosity: The Generous Become More Generous

Tithing trends have evolved:
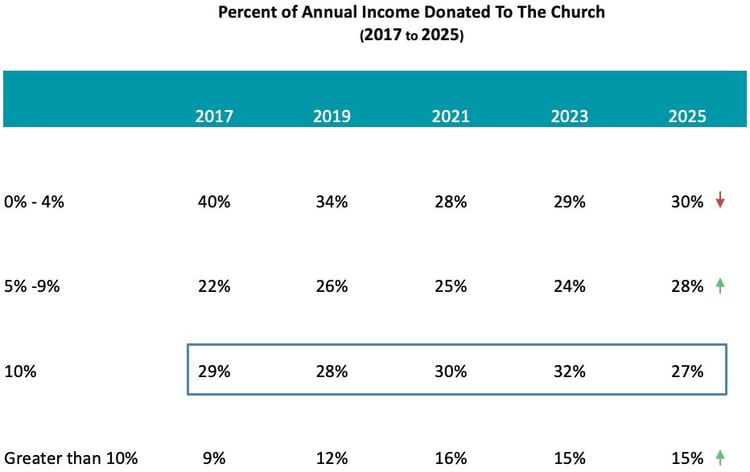
- 27% of churchgoers consistently give 10% of their income, unchanged since 2017
- Giving of 5% to 9% and 11% to 20%+ of income has increased
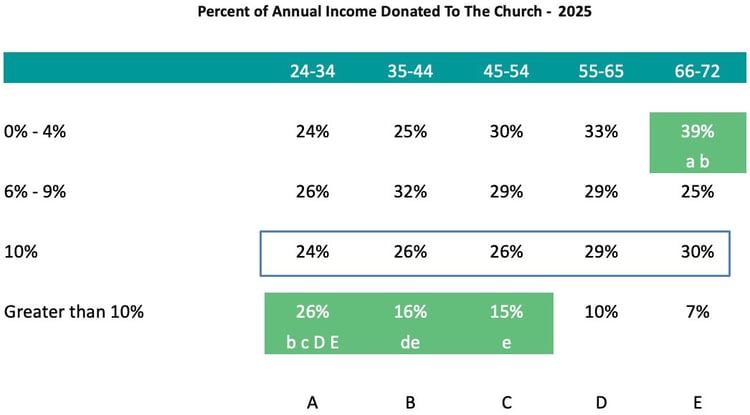
- Young adults (24–34) are the most likely to give more than 10%
- Older adults (66–72) are most likely to give less than 4%
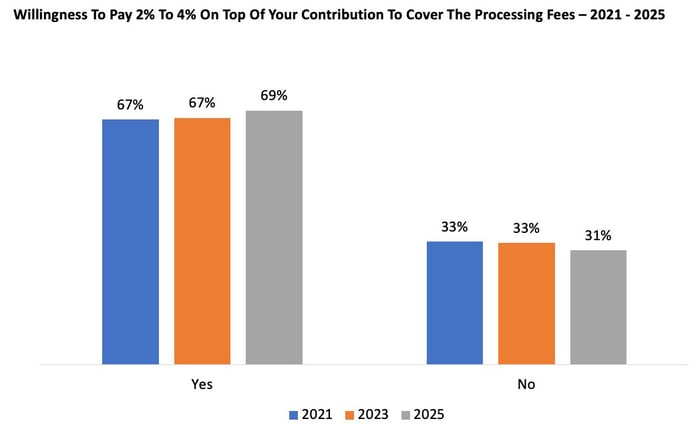
Notably, 69% of givers are willing to pay 2% to 4% in processing fees, with willingness highest among 24- to 54-year-olds.
Increased Preference for Digital Giving

Awareness and usage of digital giving options (apps, recurring debit/credit, kiosks, text-to-give) has surged, especially among younger and middle-aged adults. In contrast, traditional methods like cash and checks are declining.
- Credit/debit cards are the most used digital method.
- 30% to 45% are “very comfortable” using electronic methods; 21% say the same for crypto.
- Apple Pay and Google Pay usage is flat (13%–14%).
More Participation in Church Activities and Digital Communication
From 2015 to 2025:
- Frequent (weekly+) attendance declined slightly, while monthly+ attendance also increased.
- Participation in ministries and volunteer activities has risen, especially among 24- to 44-year-olds
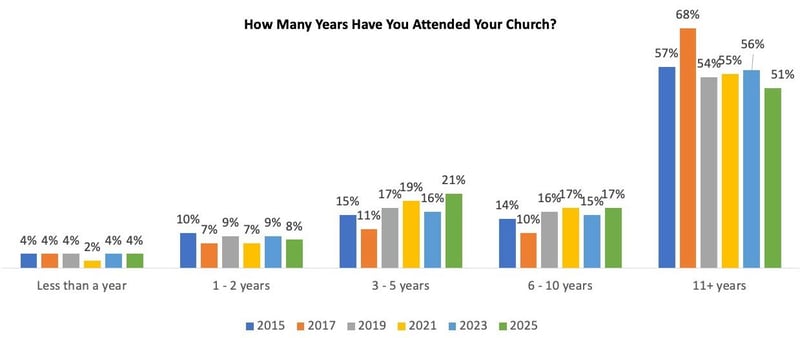
- Loyalty remains high — over 50% of churchgoers have attended the same church for 11+ years, though that figure is declining.
Digital communication is now dominant for churchgoers:
- Preferred channels include email, Facebook, church websites and worship announcements.
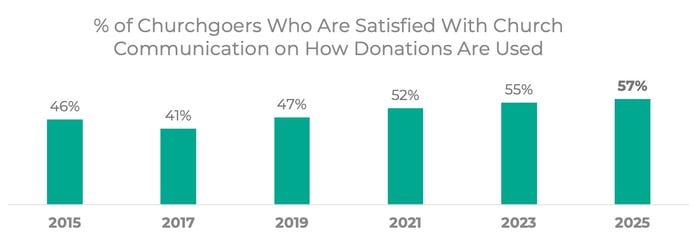
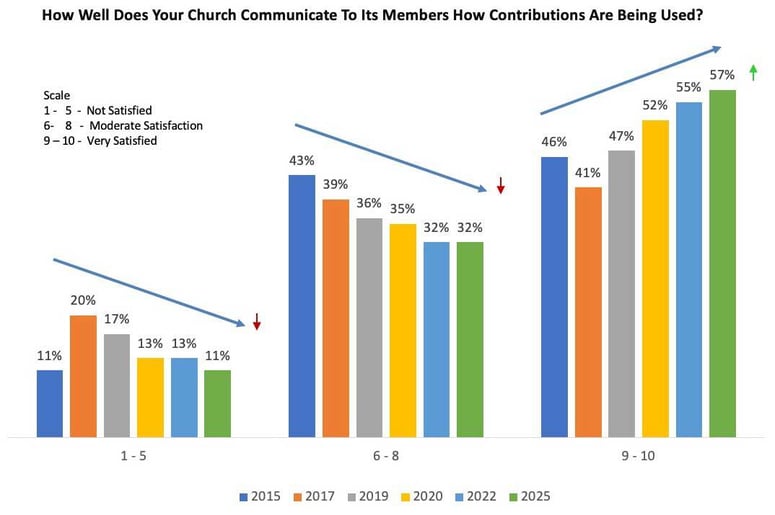
- Satisfaction with church communication has grown from 46% in 2015 to 57% in 2025.
- Younger adults favor Facebook and apps, while older adults still prefer traditional communication methods including bulletins and in-service announcements.
eGivers Differ from Traditional Givers

As of 2025, churchgoers are evenly split between eGivers (50%) and Traditional Givers (50%). However, they differ sharply in behavior:
eGivers
- More likely to be ages 24 to 44, higher-income earners and college/post-grad educated
- Contribute more frequently and in higher amounts (19% give more than 10% of income)
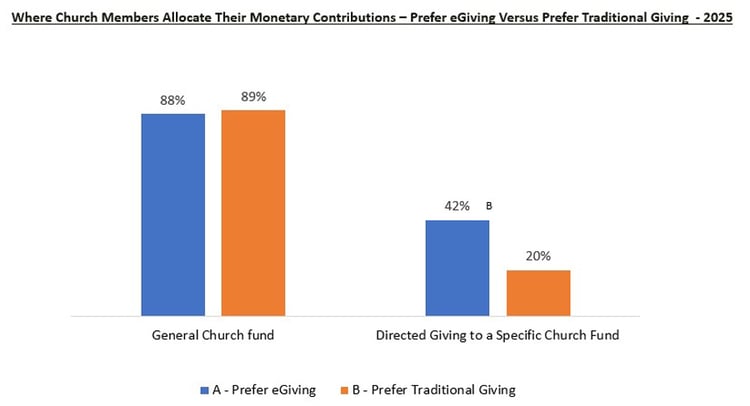
- Are more likely to allocate gifts to specific funds (42%)
- More open to digital tools, including covering processing fees (88%)
- Attend contemporary services and consume more content via streaming, TV and mobile
- Show higher satisfaction with church communications
Traditional Givers
- Skew older (55+), retired or working part-time
- Prefer in-person giving with checks or cash
- Less comfortable with digital giving technology or fee-based digital giving
- Attend traditional worship services and rely on paper-based communication
All Church Members – 2015–2025 Trends
Perceptions and Motivations Toward Giving and eGiving
Over the past decade, churchgoers have consistently emphasized community, faith-based values and community impact as primary motivations for their financial contributions. As churches increasingly adopt digital giving platforms, perceptions toward eGiving have shifted positively, especially among younger and middle-aged church members.
Key Motivations for Church Contributions
The top reasons for giving have remained steady over time, notably:
- Helping and supporting the church community
- Upholding Bible-taught values
- Belief that the church performs vital community work
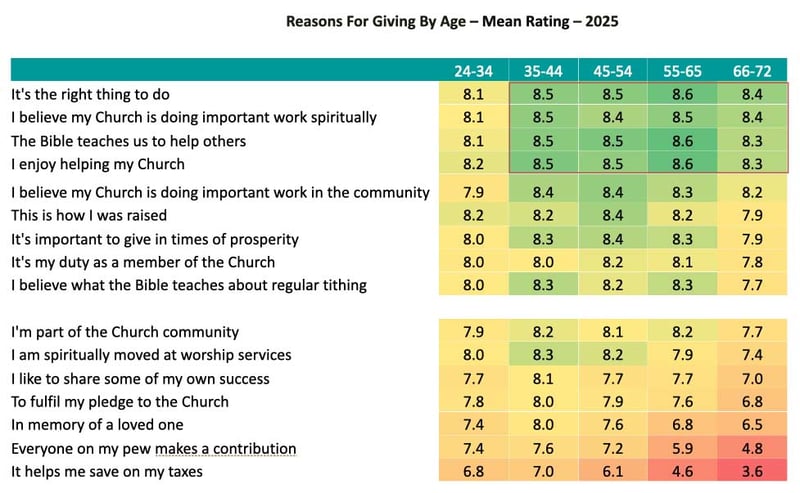
Churchgoers aged 35 to 72 consistently express the strongest positive motivations toward giving.
Trends in Perceptions of eGiving
- Positive attitudes toward eGiving have significantly improved from 2015 to 2025.
- Adults aged 24 to 54 drive this increasing acceptance, embracing eGiving as a convenient and reliable way to support their churches financially.
Top-Rated Positive Perceptions of eGiving
- Convenient and easy to use, aligning with everyday digital transactions
- Helps maintain consistent giving even when unable to attend in person
- Allows churchgoers greater control to direct contributions to specific causes or needs
Demographic Insights
- Adults aged 55 to 72 still have comparatively lower perceptions of eGiving.
- Churches need targeted communication strategies emphasizing transparency, ease of use and theological alignment to reassure and engage this group effectively.
Summary and Implications
The past decade demonstrates a clear trend toward more positive perceptions and acceptance of digital giving solutions among church communities. To capitalize on this, churches should:
- Regularly highlight the ease, security and convenience of digital giving.
- Emphasize stories that illustrate how eGiving directly supports the church’s missions and community projects.
- Provide ongoing education and reassurance — particularly targeting older demographics — to dispel lingering doubts and enhance adoption.
Understanding and leveraging these motivations and perceptions will be key for churches aiming to grow their congregations and deepen engagement in the digital age.
A Closer Look at the Data
“Helping/supporting the Church community”, “Bible taught values”, and “The Church is doing important community work” are the top reason for making contributions.
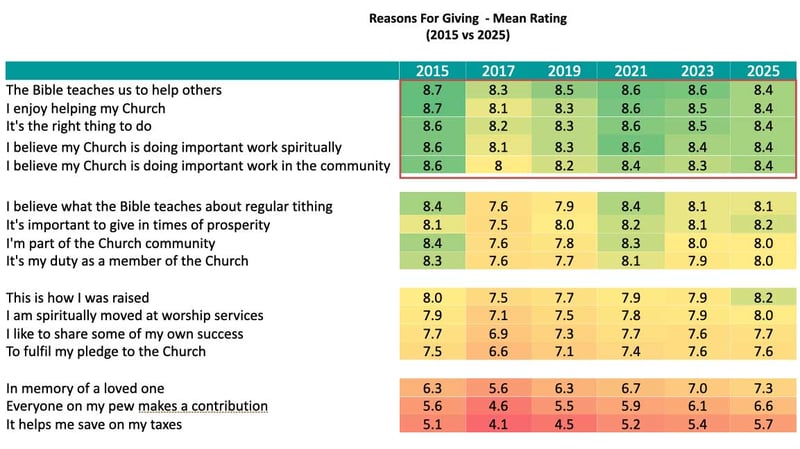
35 - 72-year-olds have the strongest positive perceptions toward Church giving.
From 2015 to 2025 top-rated perceptions toward eGiving have become more positive.
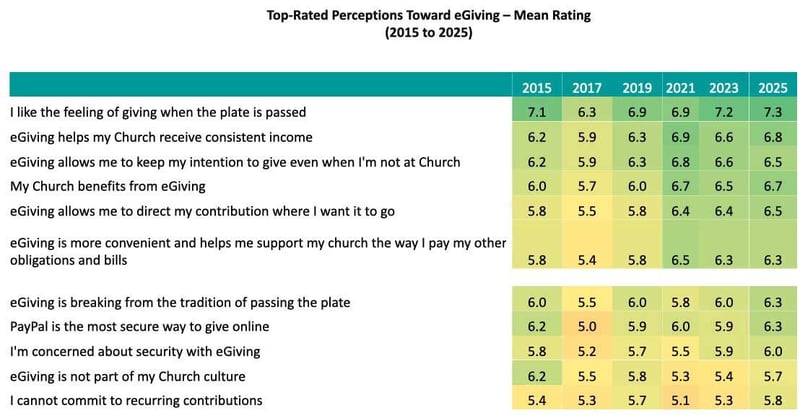
The positive perceptions toward eGiving are being driving by 24 – 54-year-olds.
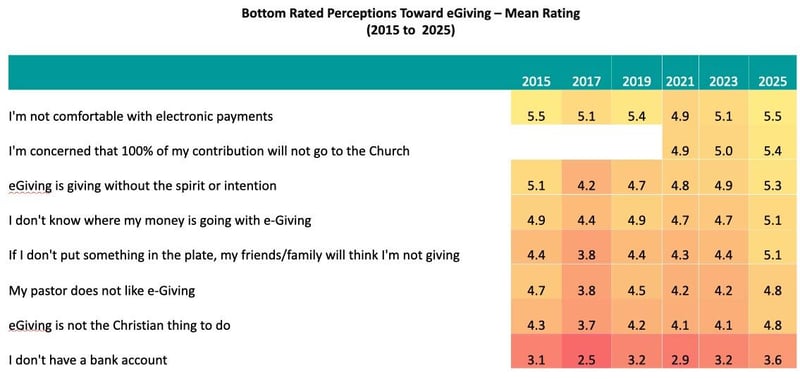
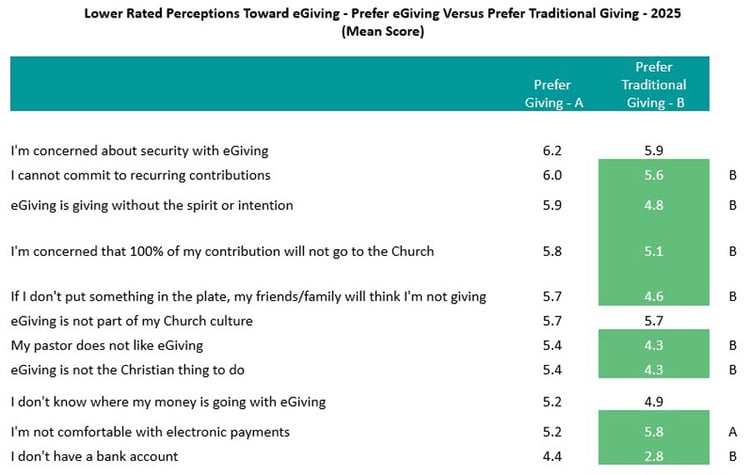
“I’m concerned that 100% of my contribution will not go to the Church”, and “eiving is not the Christian thing to do” have eroded since 2015, whereas “My pastor does not like eGiving” is unchanged.
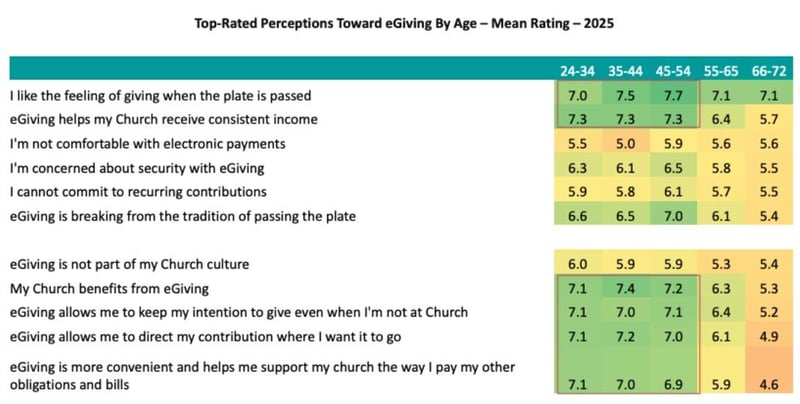
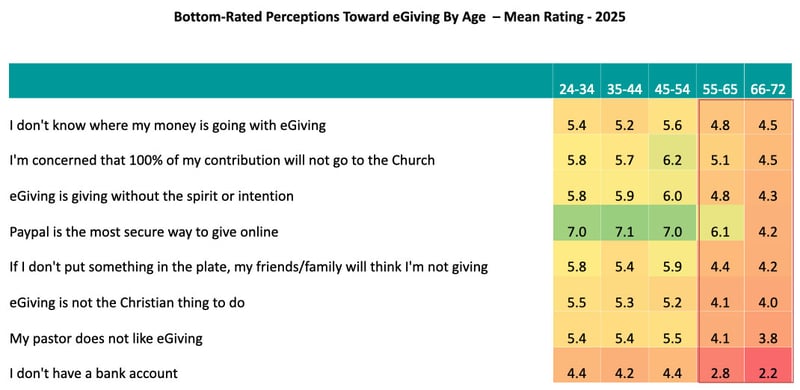
55 – 72-year-olds have the lowest perceptions toward eGiving.
Giving Behavior
Giving behaviors among churchgoers have notably evolved from 2015 to 2025, driven by changing attendance patterns and a growing preference for targeted and digital giving methods.
Attendance Patterns and Their Impact
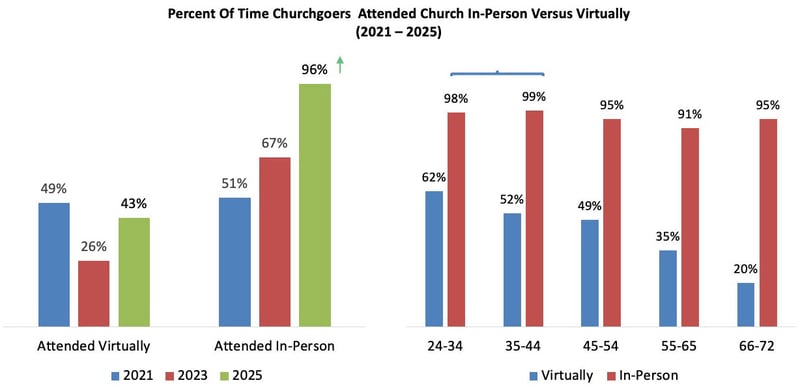
- In-person attendance significantly increased from 51% in 2021 to 96% in 2025, though virtual attendance remains substantial, particularly among those aged 24 to 44.
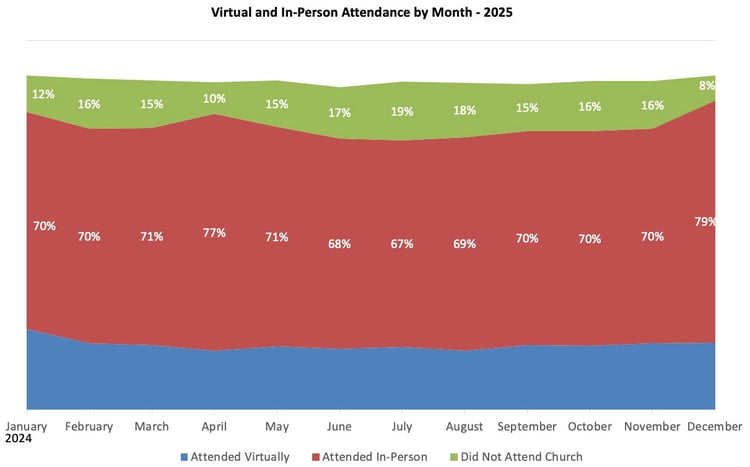
- In 2024, monthly in-person attendance ranged from 70% to 79%, with virtual attendance between 8% and 19%.
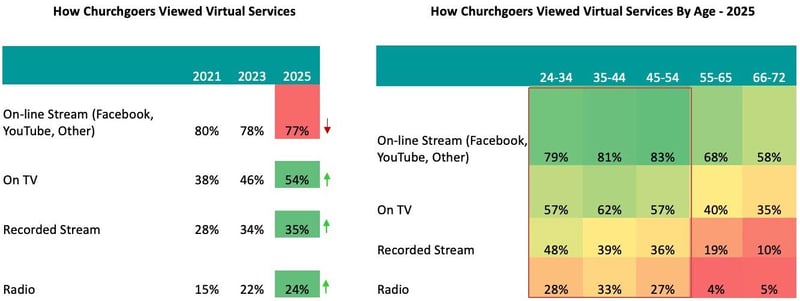
- Virtual participation continues to represent a vital opportunity for church contributions, particularly using platforms like TV, recorded streams and radio, which are increasingly preferred over online streams.
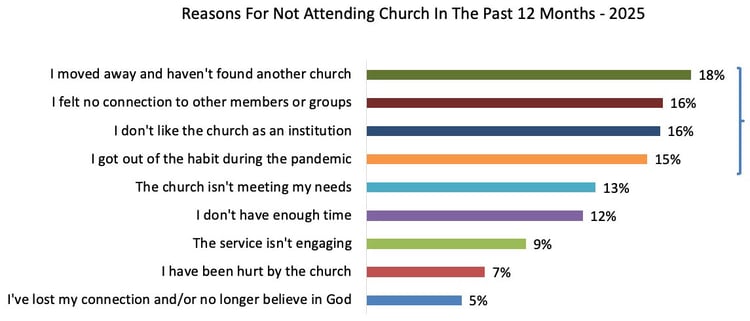
- Key reasons cited for not attending church include moving, feeling disconnected, dissatisfaction with church institutions and habits developed during the pandemic.
Trends in Monetary Contributions
- The proportion of churchgoers giving 10% of their income has remained consistent since 2017, at 27%.
- There's been an increase in givers contributing between 5% and 9% and greater than 10% of their income, especially among younger adults (24–34), who are most likely to give at higher levels.
- Older adults (66–72) tend to give less, primarily within the 0% to 4% range of their annual income.
Frequency and Type of Giving
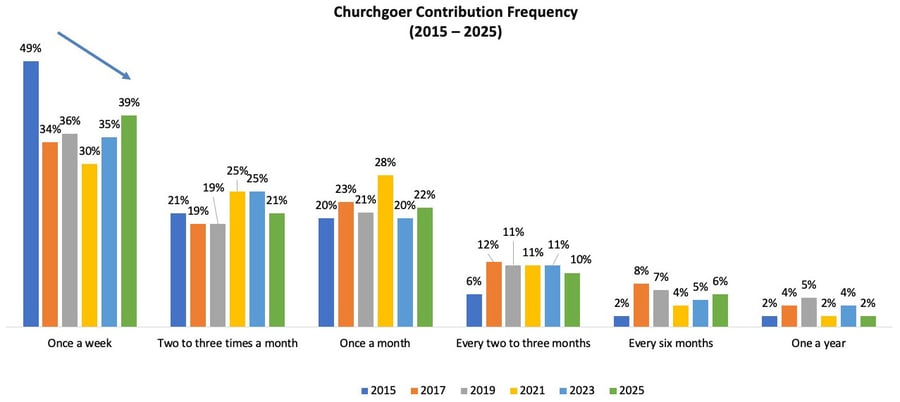
- Weekly giving has declined notably, from 49% in 2015 to 39% in 2025, while monthly giving remains consistent.
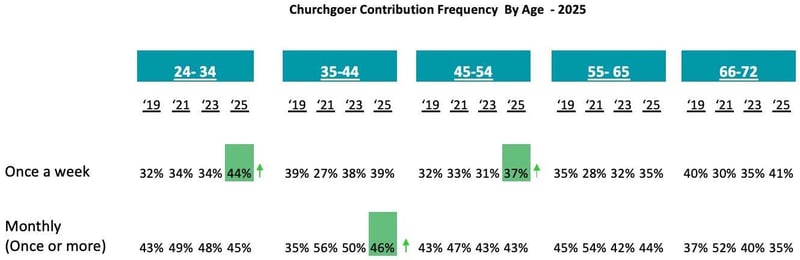
- Younger (24–34) and middle-aged (45–54) groups are more likely to give on a weekly basis, while those aged 35 to 44 show increased monthly giving.
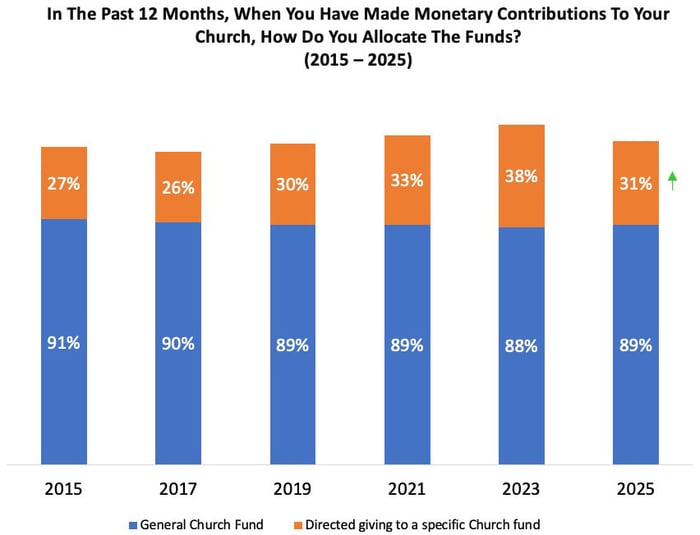
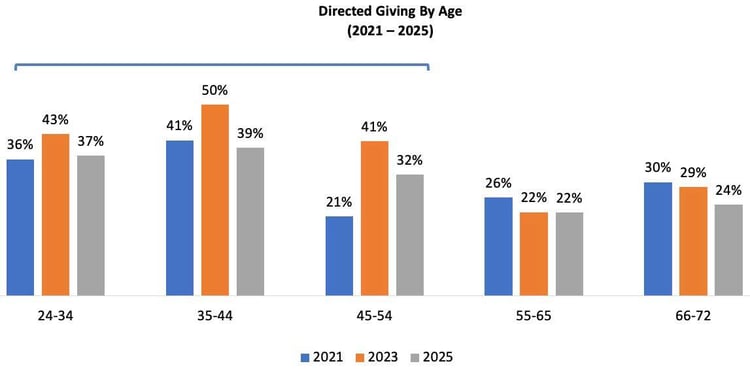
- Directed giving — allocating contributions to specific church funds — rose from 27% in 2015 to 31% in 2025, reflecting a growing preference for purpose-driven donations.
Decision-Making and Willingness to Cover Fees
Individual decision-making on giving has increased from 65% in 2017 to 74% in 2025, notably among younger demographics (24–44).
Combined spouse decision-making has significantly declined from 32% to 15%.
A steady 69% of churchgoers remain willing to pay a 2% to 4% processing fee on top of their contributions, with the highest acceptance among ages 24 to 54.
Summary and Implications
To maximize engagement and generosity, churches should:
- Maintain hybrid worship models to accommodate both in-person and virtual attendees.
- Encourage targeted, recurring giving and purpose-driven giving methods tailored to evolving preferences.
- Communicate clearly about the impact and allocation of contributions, emphasizing transparency and ease of digital giving.
These insights highlight crucial shifts that churches can leverage to foster consistent and impactful giving behaviors.
A Closer Look at the Data
In-person attendance increased from 2021 – 2025 (51% to 96%). In-person and virtual attendance is highest among 24 – 44-year-olds.
In-person attendance varied from 70% to 79% a month; Virtual attendance varied from 8% to 19% a month throughout 2024.
“Moving”, “Not feeling connected the Church”, “Not liking the Church as an institution” and “Got out of the habit during the pandemic” are key reasons for not attending Church.
From 2021 to 2025, churchgoers that attended virtual services increased their use of “On TV”, “Recorded Stream” and “Radio”, while decreasing their use of “On-line Stream”.
24 – 54-year-olds have the highest usage all virtual attendance media.
The percent of churchgoers giving 10% of their income is unchanged since 2017. By comparison, “0% - 4%” givers have declined, whereas “5% - 9%” and “Greater than 10%” givers have increased since 2017.
Churchgoers giving 10% of their income are equally distributed across age groups. A higher percentage of churchgoers age 66 – 72 give “0% - 4%” of their income. 24 – 34-year-olds are more likely to give greater than 10% of their income.
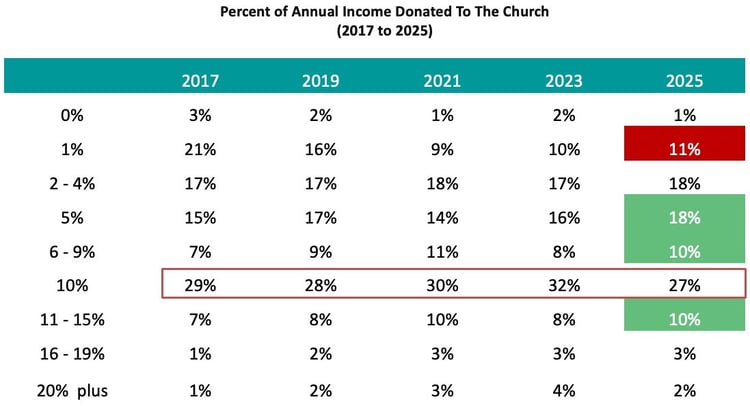
27% of churchgoers give 10% of their income to the Church, unchanged since 2017. The percent of churchgoers giving ‘5%”, “6% - 9%”, and “11% - 15%” has increased since 2017. By comparison, 1% givers have declined.
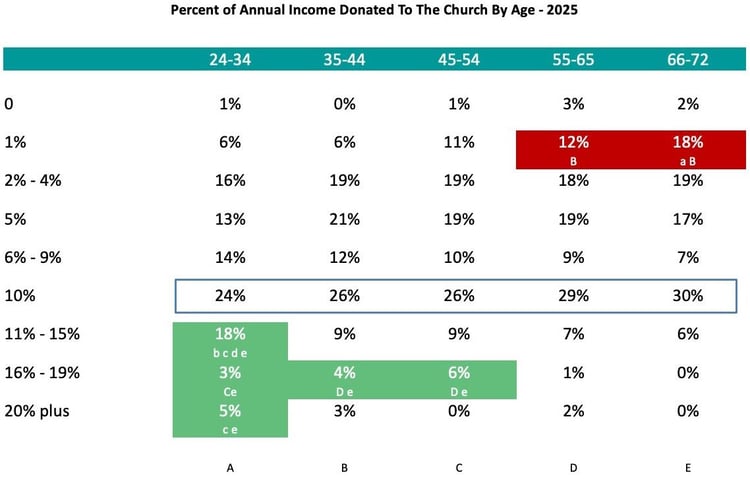
24 -34-year-old churchgoers give more on a percentage level. 10% giving is equally distributed across age cohorts.
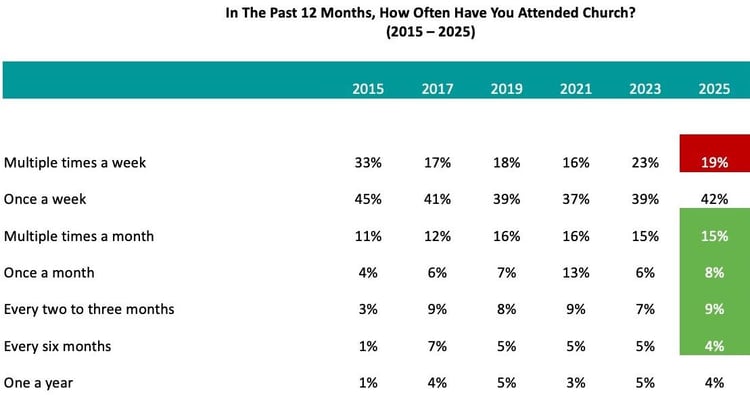
Once-a-week giving has decreased from 49% to 39% since 2015. Giving multiple times a month and monthly giving are unchanged from 2015 to 2025.
Once-a-week giving is directionally higher among 24 – 34 and 45- 54-year-olds from 2019 to 2025. By comparison, 35 – 44-year-olds have increased their monthly or more often giving during the same time.
Directed giving to a specific Church fund increased from 27% in 2015 to 31% in 2025. This supports churchgoers’ perception that eGiving can be used for directed contributions.
Directed giving is concentrated among 24 - 54 -year-olds.
Individual giving decision making increased from 65% in 2017 to 74% in 2025. By comparison, combined spouse giving decisions declined from 32% to 15%.
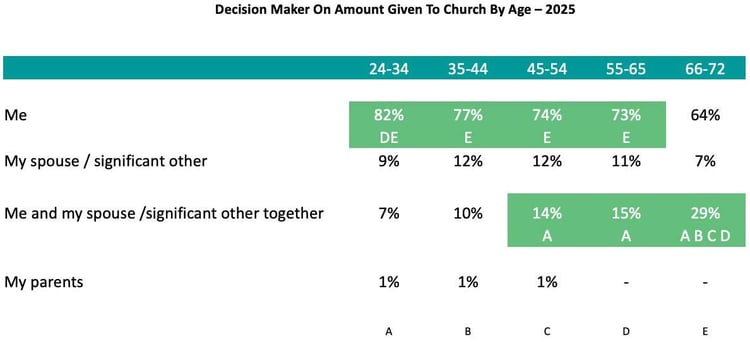
24 – 44-year-olds are more likely to make individual giving decisions, whereas combined spouse giving decisions occur more often among 66- 72-year-olds.
69% of churchgoers are willing to pay 2% - 4% on top of their contribution to cover a Church processing fee. This trend is unchanged from 2021 – 2025.
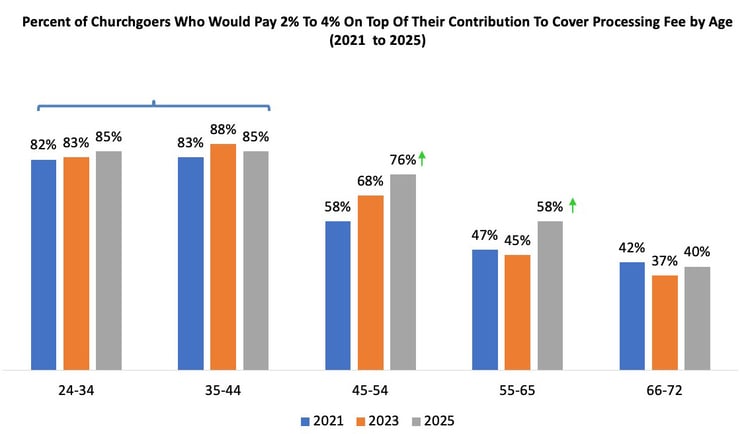
Willingness to pay a 2% - 4% fee is higher among 24 – 44-year-olds (85%), 45 – 54-year-olds (76%) and 55- 65-year-olds (58%). 66- 72-year-olds are least likely to pay the fee.
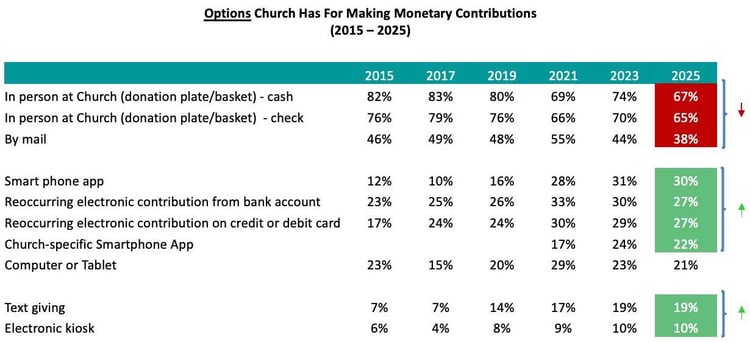
Churchgoer awareness of eGiving options (Smart phone, Reoccurring electronic (Bank, Debit or Credit), Computer/Tablet, Church-specific Smartphone app, Text Giving) increased from 2015 to 2025. In contrast, awareness of traditional giving options, while still high overall, have decreased since 2015.
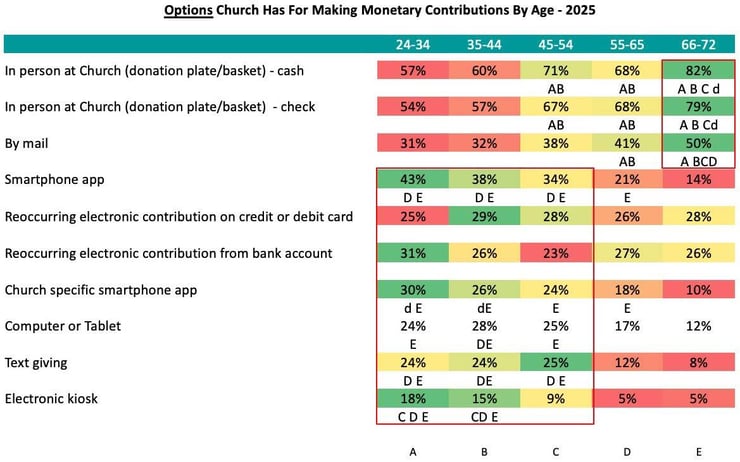
Awareness of eGiving options (Smartphone, Church-specific Smartphone app, Text giving, Computer/Tablet and Electronic kiosk) is highest among 24 - 54-year-olds. By comparison, 55 – 72-year-olds are more aware of traditional giving options.
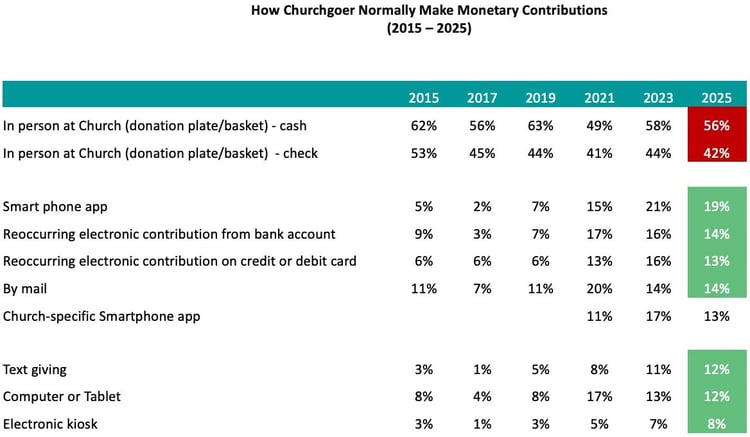
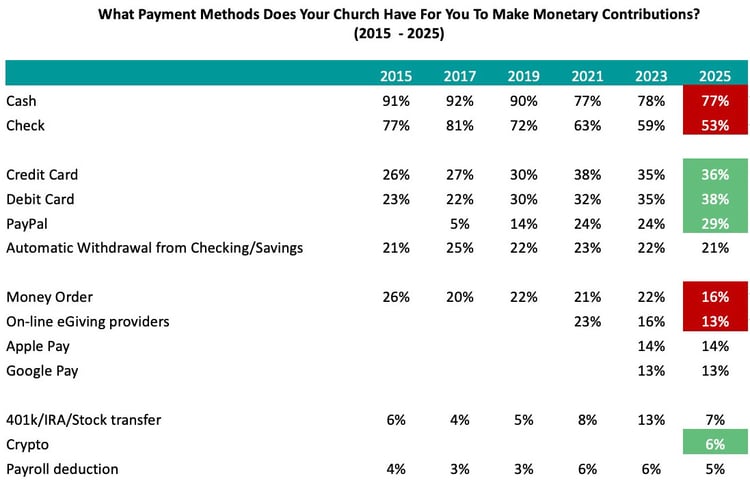
In-person contributions, while used most often, have decreased from 2015 – 2025. By comparison, usage of digital contributions methods have increased during the same time.
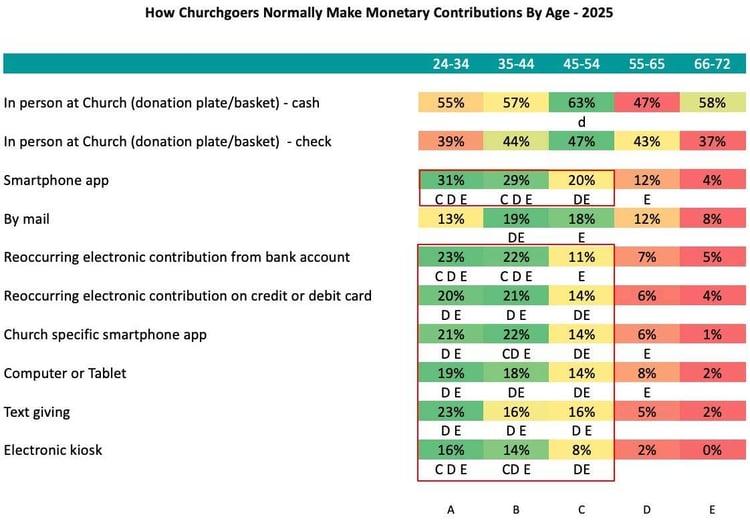
Usage of digital contribution methods is highest among 24 – 54-year-olds.
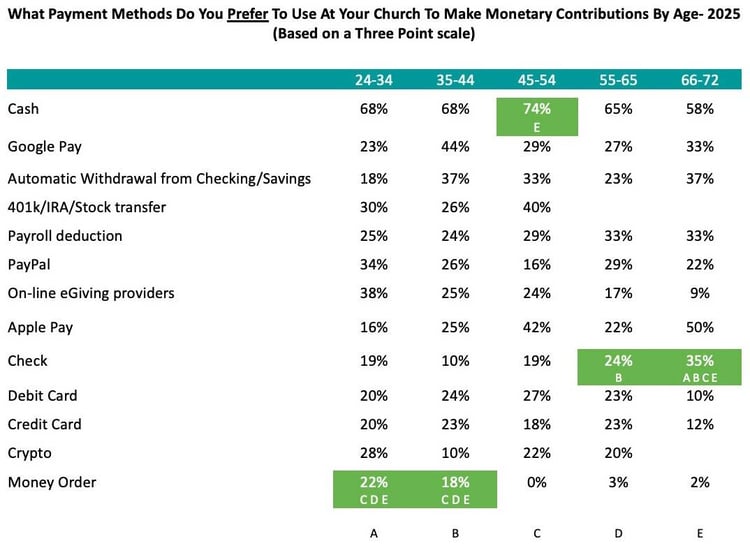
Awareness of using “Credit/Debit Cards” to make contributions increased from 2015 to 2025. “Apple Pay” and “Google Pay” usage are unchanged (13% - 14%). “Cash”, “Check”, “Money Order” and “On-line eGiving providers” usage declined during the same time.
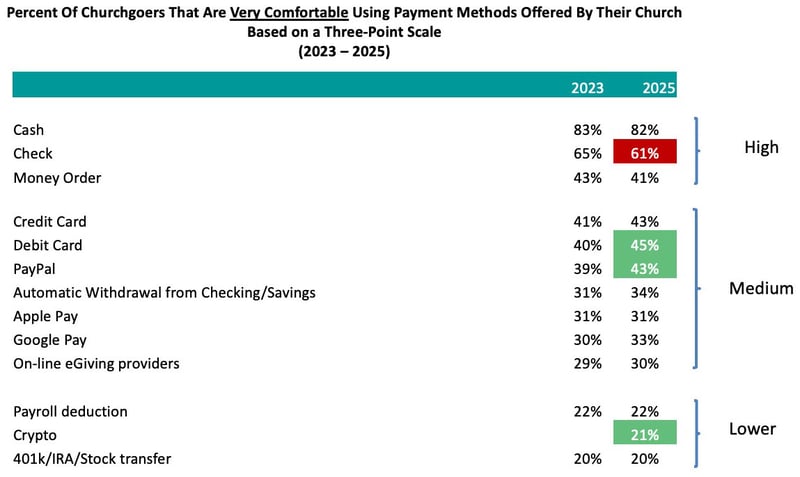
30% - 45% of churchgoers are very comfortable using electronic payments and credits cards to make contributions. 21% are very comfortable using Crypto.
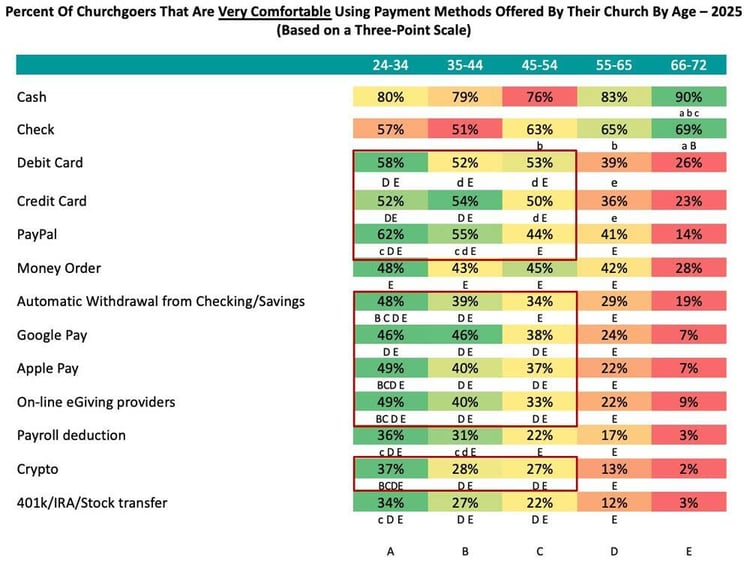
Churchgoers aged 24 – 54 are most comfortable using digital payment methods.
Preference for using electronic payment methods and cash to make contributions increased from 2015 to 2025.
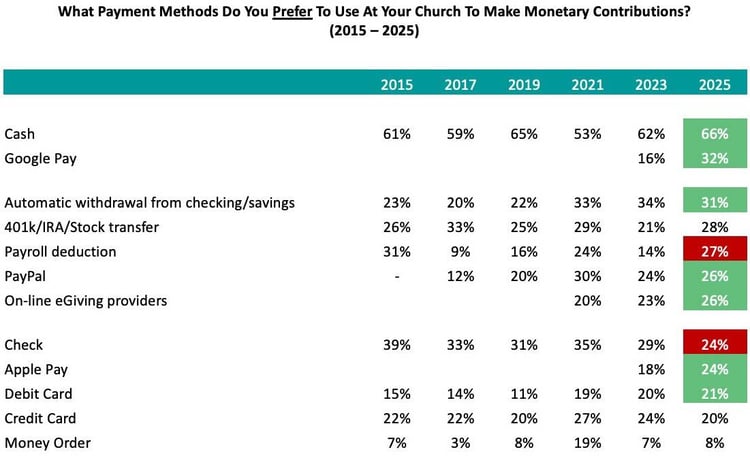
Digital giving is equally preferred across age groups. Crypto is preferred by churchgoers age 24 – 54.
Frequent Church attendance of “Multiple times a week” has declined from 2015 to 2025, while “Multiple times a month or more” attendance has increased.
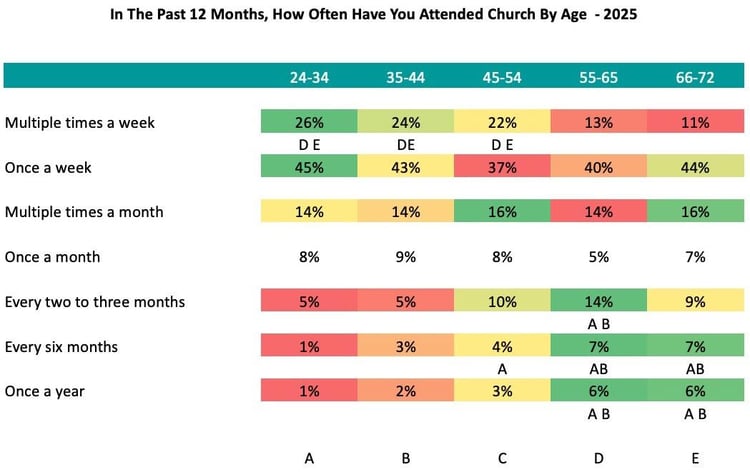
Churchgoers aged 24 – 54 attend church most often.
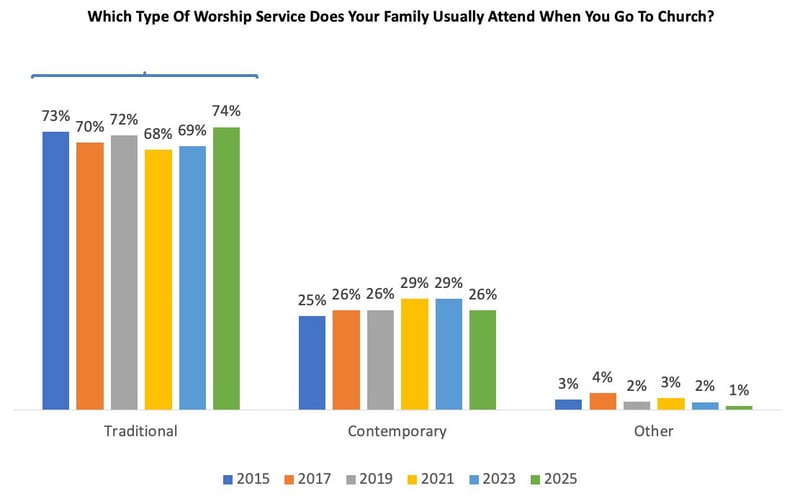
Three out of four churchgoers have consistently attended traditional services from 2015 to 2025.
Churchgoers are loyal to their church. Over 50% have been members of the same church for 11+ years. Since 2015, 11+ year members have declined.
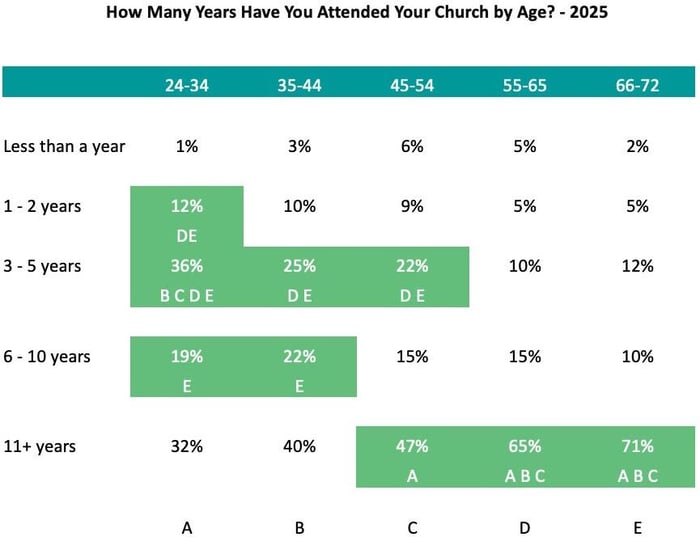
As is expected, Church member tenure increases as they age.
Church Activities, Attitudes and Attendance
From 2015 to 2025, participation in church activities, attitudes toward communication and overall attendance patterns have experienced notable shifts, significantly influenced by demographic factors and digital media preferences.
Trends in Church Ministry Attendance
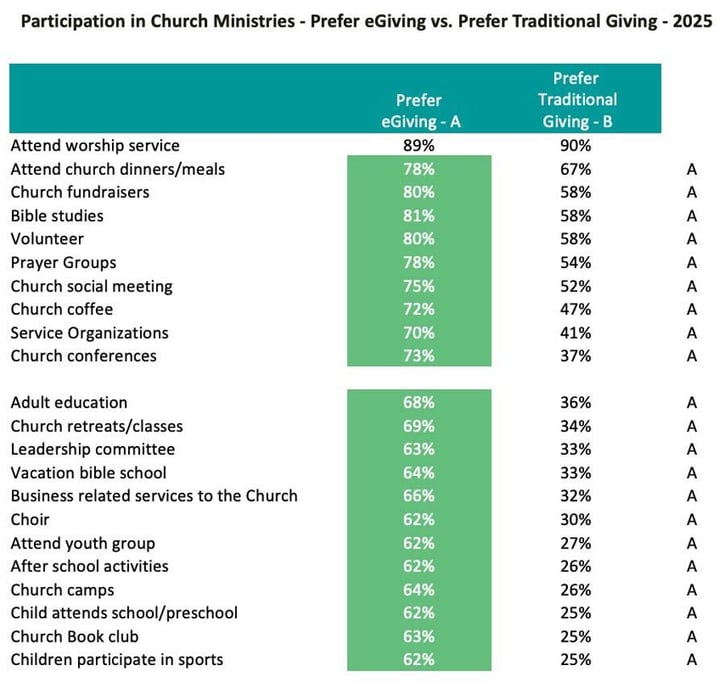
- Attendance at most church ministries, including worship services, dinners, volunteering, church fundraisers, Bible studies, prayer groups and social meetings, has increased consistently over the decade.
- Adults aged 24 to 44 show the highest participation rates across all ministries, signaling a robust engagement opportunity within this demographic group.
Preferred Payment Methods for Church Activities
- Digital payment methods have risen in popularity for ministry-related payments, with electronic payments and cash emerging as the most preferred methods overall, whether it's a regular tithe or a special event like Giving Tuesday.
- Notably, usage of digital payments for ministries increased significantly from 2017 to 2025, particularly among adults aged 24 to 44, who also show the highest usage of mobile platforms such as Apple Pay and Google Pay.
Communication and Satisfaction
- Church member satisfaction with how churches communicate about contributions improved markedly, rising from 46% in 2015 to 57% in 2025.
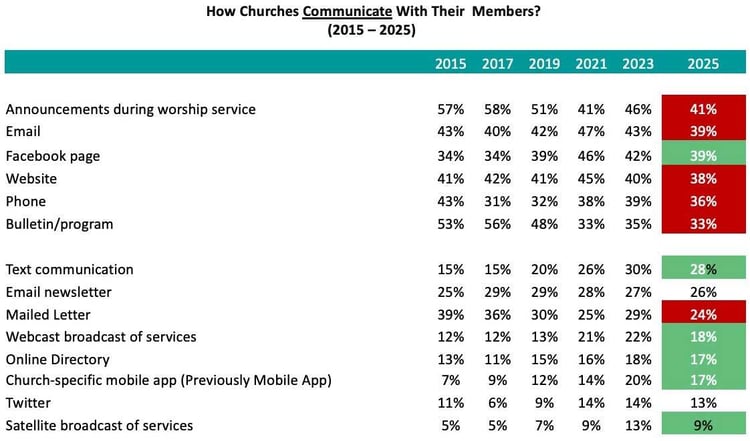
- Awareness and preference for receiving church communications via digital methods like Facebook, text messages, webcasts and church-specific mobile apps have significantly increased, while traditional methods have declined.
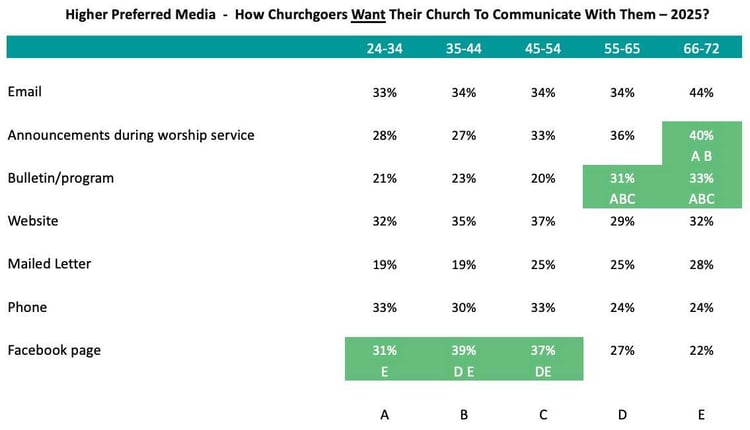
- Older churchgoers (66–77) continue to prefer traditional communication methods, such as announcements during services and printed bulletins, while younger demographics (24–54) prefer digital platforms like Facebook.
Summary and Implications
Churches should capitalize on these evolving attendance patterns, payment preferences and communication channels by:
- Enhance digital communication strategies and platforms to meet the preferences of younger and digitally engaged members.
- Continue to offer diverse ministry opportunities and clearly communicate their impacts to encourage higher participation.
- Leverage preferred digital payment methods to streamline financial transactions for ministries and church donations.
Adapting to these trends will enable churches to deepen member engagement, enhance satisfaction and foster sustained participation across all age groups.
A Closer Look at the Data
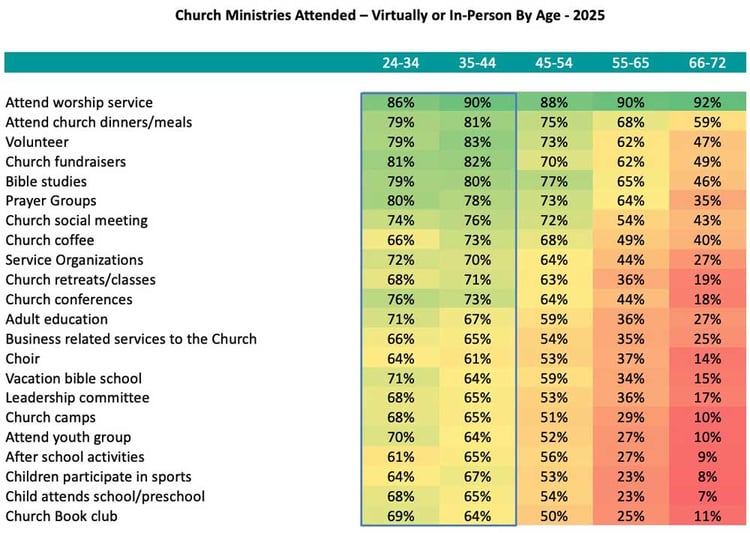
Attendance at most Church ministries has increased from 2015 to 2025.
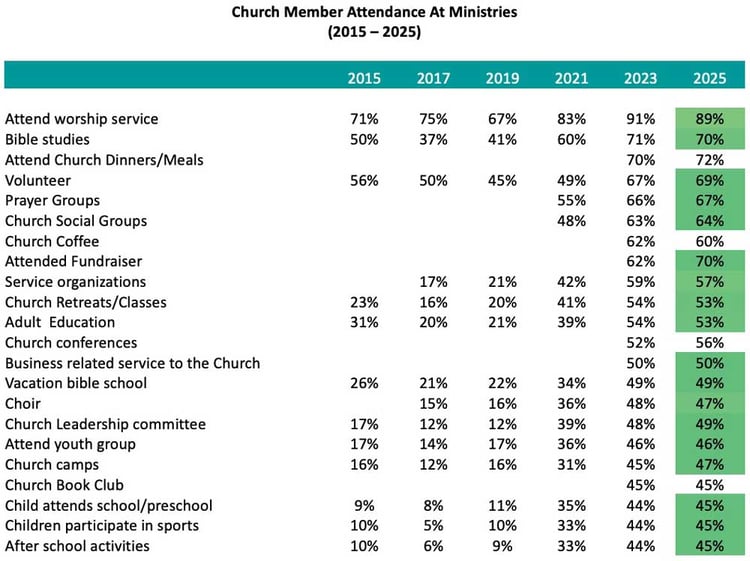
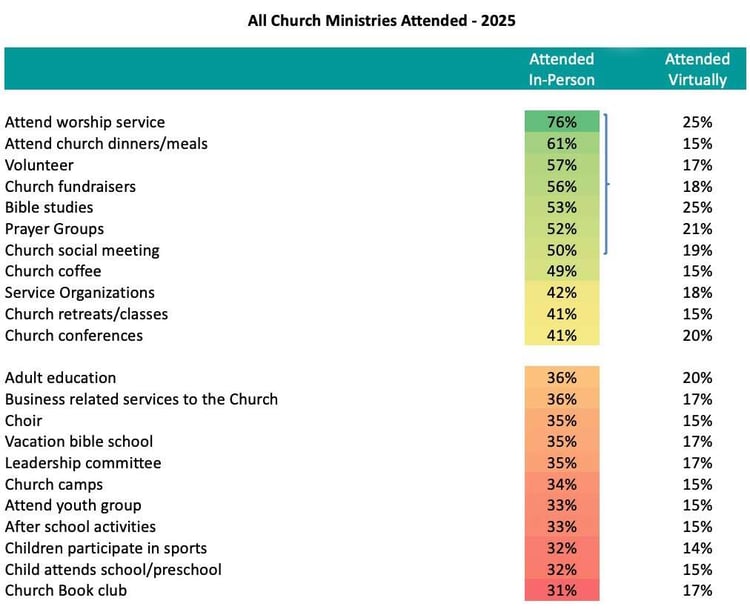
In-person attendance is highest for “Worship services”, “Church dinners/meals”, “Volunteering”, “Fundraisers”, “Bible study”, “Prayer groups” and “Church social meetings”.
24 – 44-year-olds have the highest attendance rates across ministries.
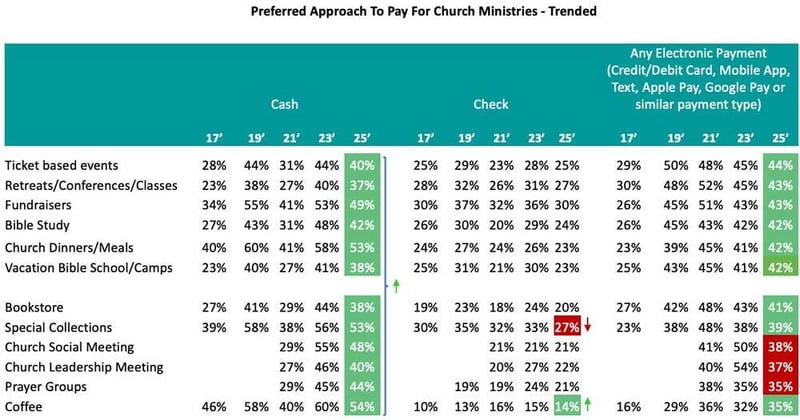
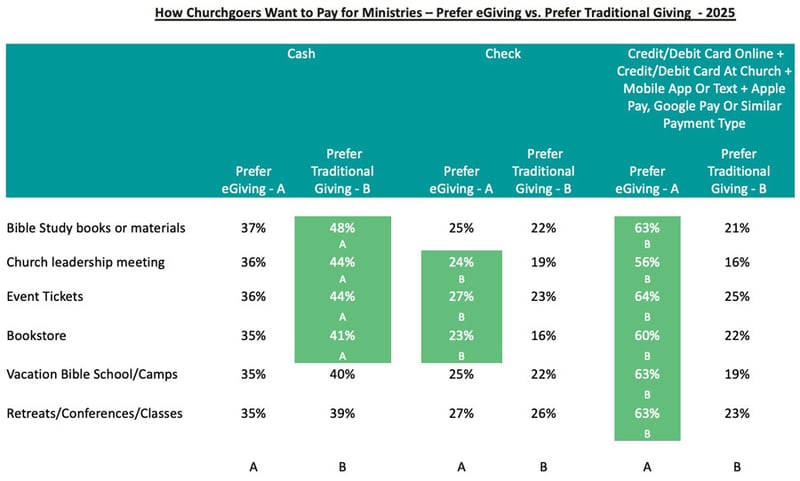
Electronic payments and Cash are the most preferred payments for Church ministries. Use of digital payments has increased for most Church ministries from 2017 to 2025.
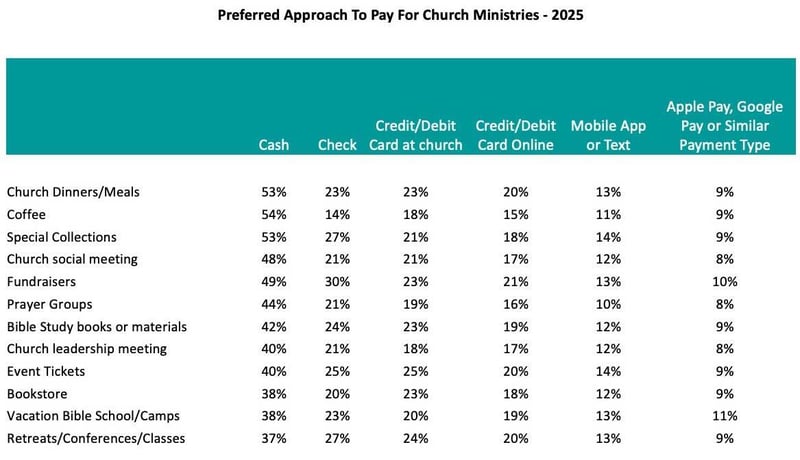
Detailed breakout of preferred payments for Church ministries.
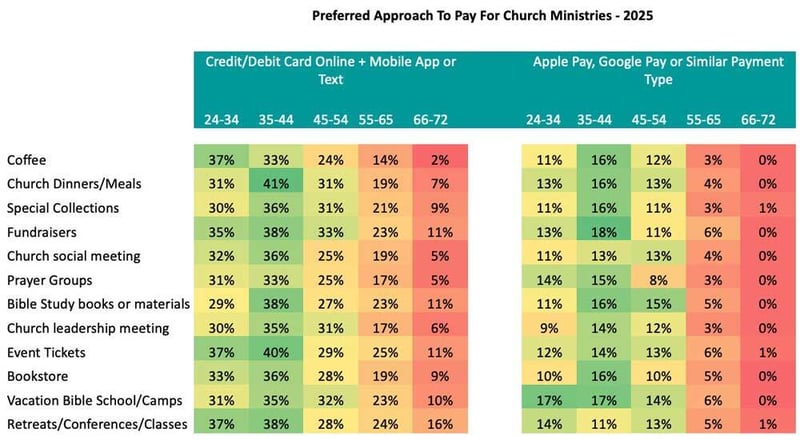
Apple Pay and Google Pay usage is highest among 24 – 44-year-olds.
Church member satisfaction (9 or 10 rating) with how their Church communicates improved to 57% in 2025 from 46% in 2015.
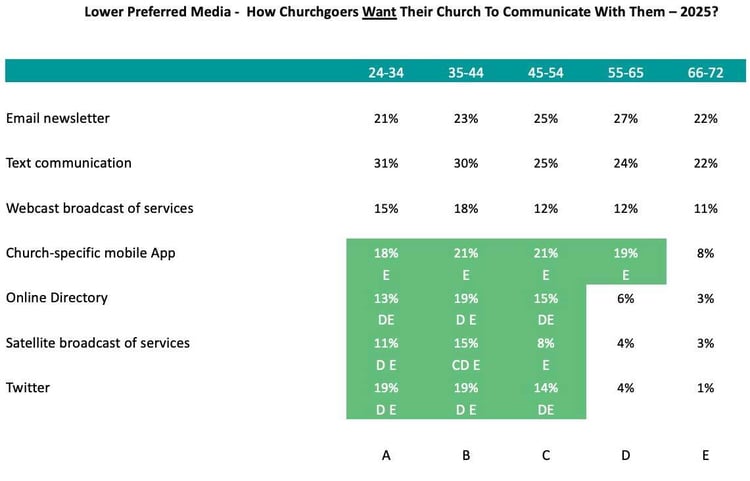
From 2015 to 2025, awareness of getting Church communications from a “Facebook page”, “Text communication”, “Webcast broadcast”, an “Online directory”, “Church-specific mobile app” or “Satellite broadcast” increased.
Awareness of getting Church communications from most traditional methods declined.
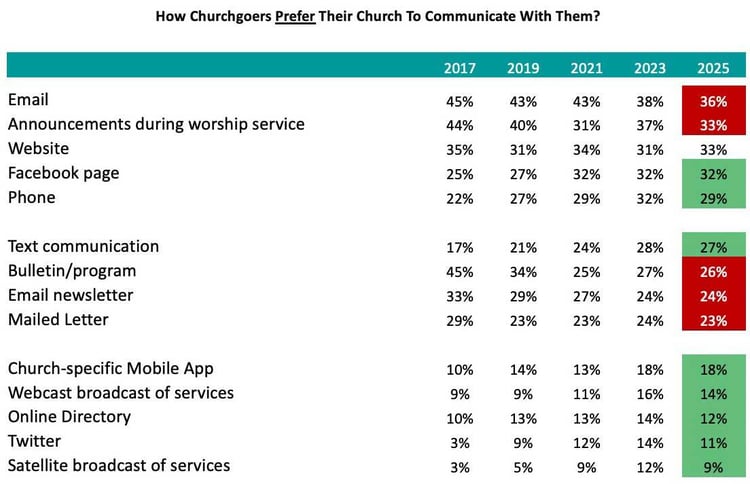
“Email”, “Announcements during worship services”, “Facebook page” and “Website” are most preferred for receiving Church announcements.
66 – 77-year-olds prefer to receive church communications from “Announcements during worship services” and “Bulletin/program”.
24 – 54-year-olds prefer to use Facebook to receive church communications compared to other age cohorts.
Preference for church communication by lower rated media.
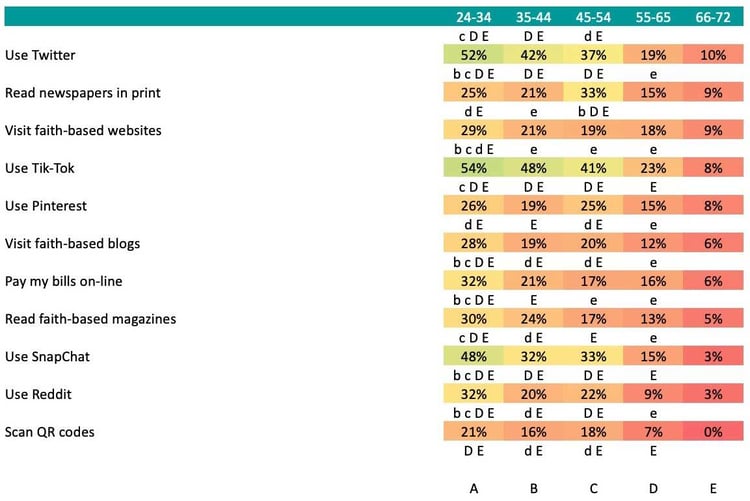
Walk, Jogging, Running, Team sports and Swimming are top churchgoer activities.
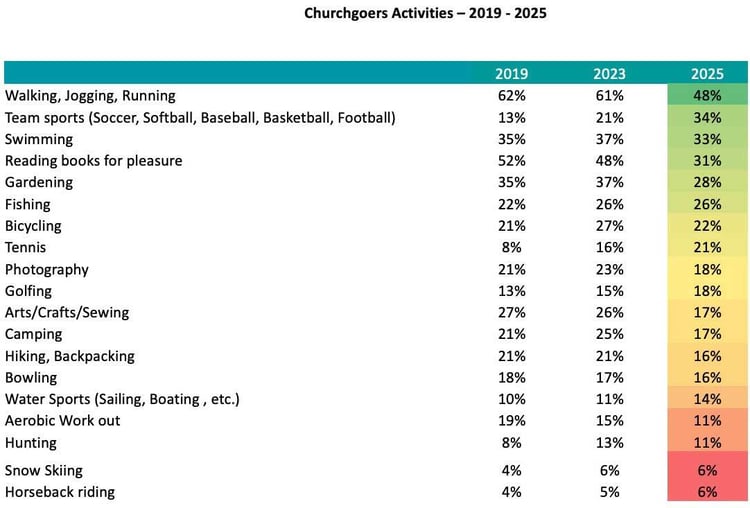
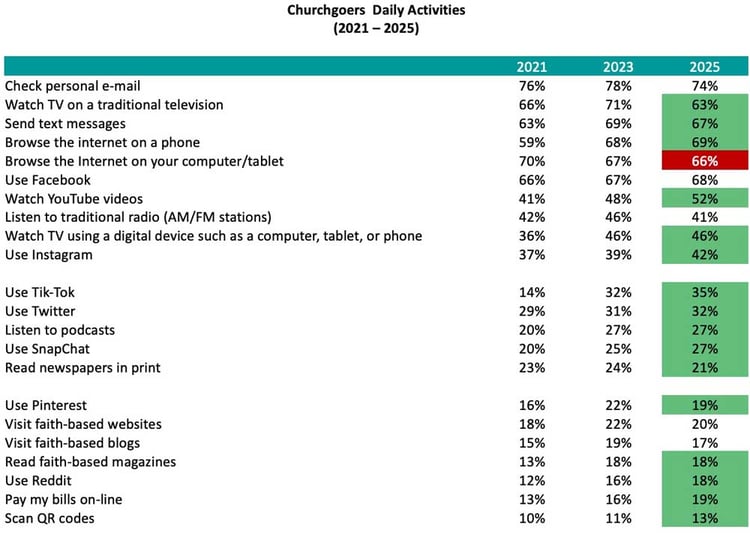
Ranking of churchgoer daily activities
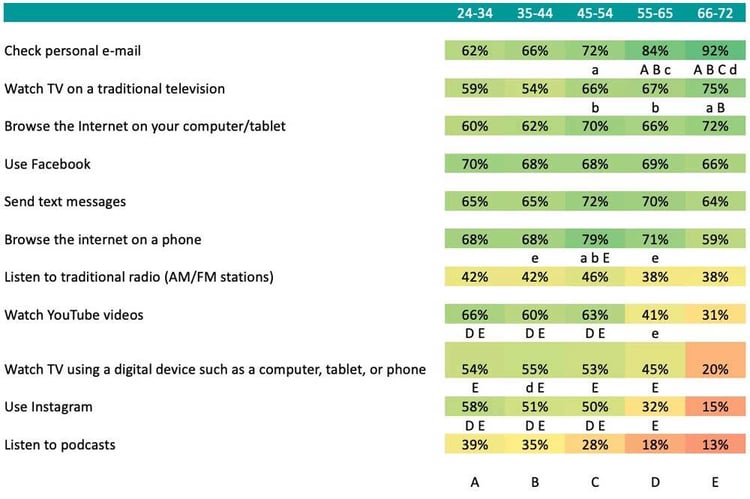
Higher Incidence churchgoer Daily Activities By Age Cohort - 2025
Lower Incidence churchgoer Daily Activities By Age Cohort - 2025
eGivers Versus Traditional Givers – 2025
Our findings show there are stark differences in the habits of eGivers versus traditional givers.
What is an eGiver?
An eGiver is a church member or supporter who gives tithes, offerings or donations through digital tools like online giving portals, mobile apps or recurring electronic payments, making giving simple and consistent.
What is a Traditional Giver?
A Traditional Giver is a church member or supporter who gives tithes, offerings or donations in person, often using cash, checks or offering envelopes during worship services or church events.
Perceptions and Motivations Toward Giving and eGiving: eGivers Versus Traditional Givers
Understanding the distinct attitudes and motivations of eGivers versus Traditional Givers is essential for churches aiming to increase generosity and engagement. Our 2025 survey of churchgoers revealed significant insights into these two distinct groups.
Demographic Differences Between eGivers and Traditional Givers
Equal split:
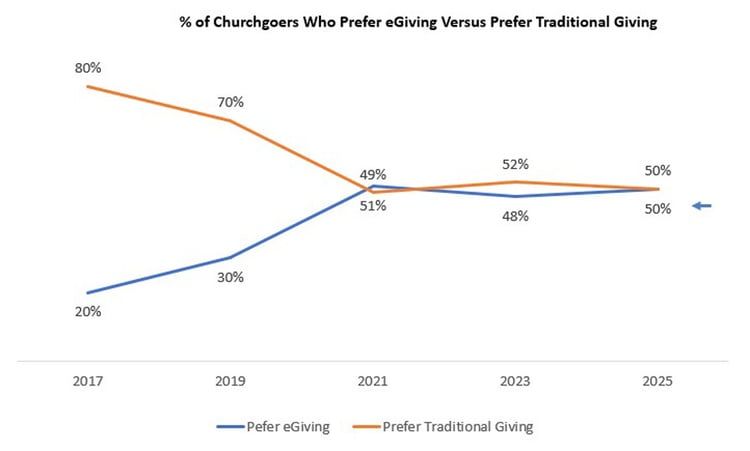
- In 2025, churchgoers were evenly divided between those who prefer eGiving (50%) and those who prefer traditional giving (50%).
Age and income
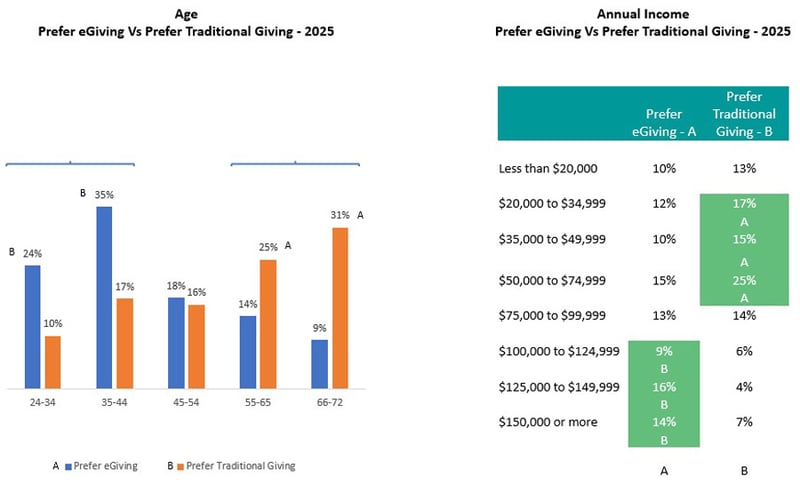
- eGivers are notably younger, predominantly aged 24 to 44, compared to Traditional Givers who typically skew older.
- eGivers also tend to have higher annual incomes, frequently earning over $100,000, compared to Traditional Givers.
Occupational and educational profile
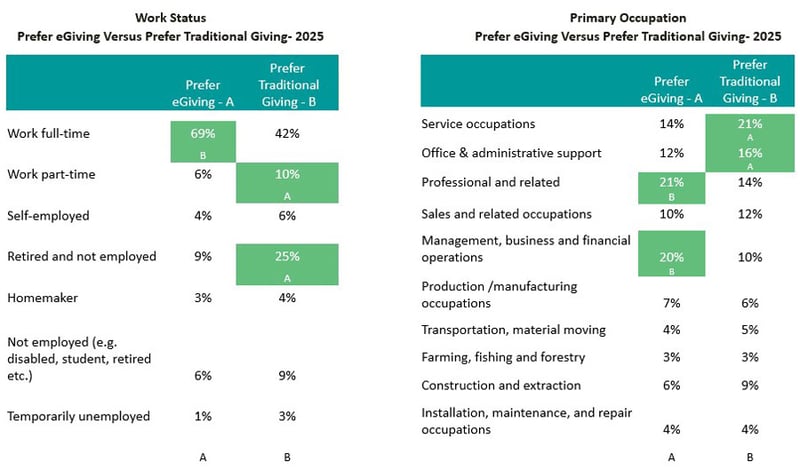
- eGivers predominantly work full-time and occupy professional, managerial or financial roles.
- Traditional Givers are more likely to be retired, working part-time or holding occupations in service or administrative support.
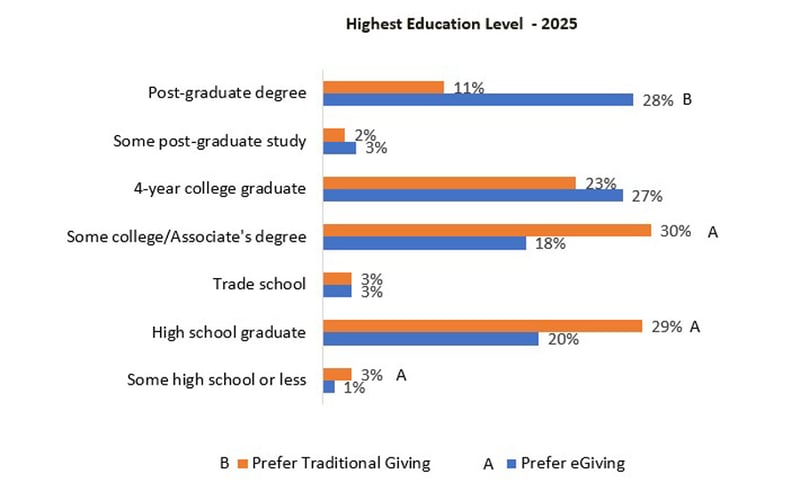
- eGivers tend toward higher educational attainment, often holding postgraduate degrees, while Traditional Givers typically report education up to high school or some college.
Key Motivational Insights
Both eGivers and Traditional Givers share similar core motivations for giving:
- Supporting their church community
- Upholding faith-based values
- Recognizing the church’s community work as valuable
Perceptions Toward eGiving
Positive Perceptions (eGivers Versus Traditional Givers)
eGivers overwhelmingly view eGiving positively, emphasizing:
- Convenience and ease aligning with their digital lifestyles.
- Consistency of contributions, even when unable to attend physically.
- Greater ability to direct their giving to specific purposes.
Traditional Givers hold significantly less favorable views toward eGiving, maintaining stronger preferences for traditional contribution methods.
Negative Perceptions and Concerns
Traditional Givers express greater hesitation around eGiving, notably concerns over:
- Security or full contributions reaching the church.
- Compatibility with traditional or religious giving values.
eGivers, by comparison, show significantly lower concern over these issues.
Financial Behaviors and Attitudes
Fee willingness
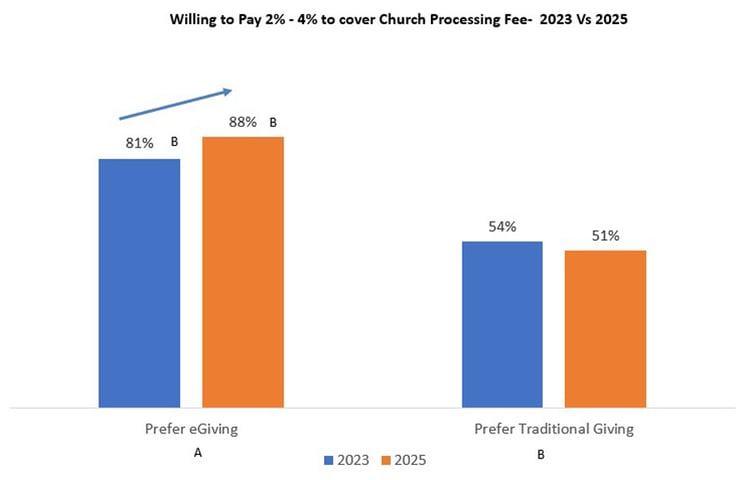
- A significant 88% of eGivers are willing to pay a 2% to 4% fee to cover church processing fees, markedly higher than the 51% among Traditional Givers.
- This willingness has notably increased among eGivers since 2023.
Contribution levels
- Both groups give similarly at the 10-percent church tithing level.
- However, eGivers are more likely to contribute higher amounts (11-20 percent of their salaries), while Traditional Givers more frequently give 0-6 percent of their income.
Directed giving
- eGivers strongly prefer to direct their contributions toward specific funds or causes (42%), more than double the rate of Traditional Givers (20%).
Encouraging Increased Giving Among eGivers
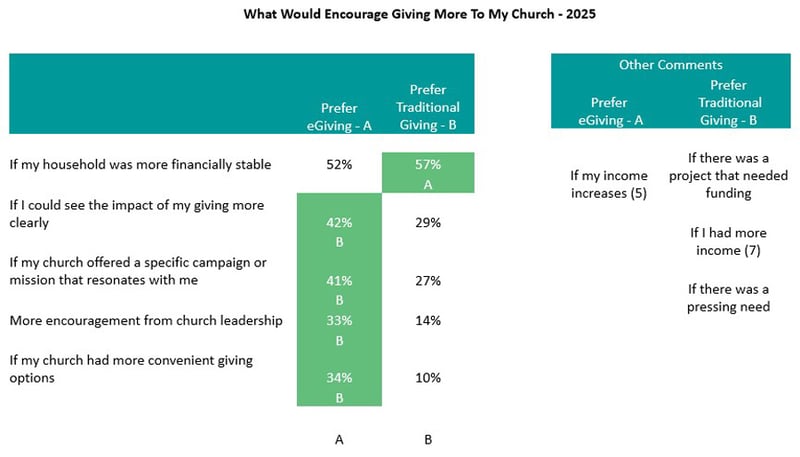
Top strategies to motivate eGivers to increase giving include:
- Providing greater financial stability and transparency in church finances
- Clearly illustrating the impact of their contributions
- Offering targeted campaigns that resonate personally
- Strong encouragement and engagement from church leadership
- Making giving methods more convenient and digitally accessible
Summary and Actionable Insights
The distinct differences between eGivers and Traditional Givers highlight the need for churches to implement segmented strategies:
For eGivers
- Emphasize convenience, impact visibility, transparency and digital tools.
- Actively promote directed giving opportunities.
For Traditional Givers
- Gradually introduce and educate around digital giving options as part of your church stewardship ministry.
- Reinforce transparency and alignment with traditional values to ease concerns.
Adopting tailored strategies for both groups can substantially boost overall generosity, deepen engagement, inspire confidence in church stewardship of resources and bridge the gap between traditional and digital church giving cultures.
A Closer Look at the Data
The percentage of churchgoers that prefer eGiving is equal to the percentage of churchgoers that prefer traditional giving approaches (50%/50%).
Churchgoers that prefer eGiving are younger (24 – 44) and have higher annual incomes compared to Traditional Givers ($100k or more).
eGivers skew “Work full time” and have “Professional, Management, Business and Financial Operations” occupations. By comparison, Traditional Givers skew “Retired/not working”, “Work part-time”, “Service” and “Office administration support” occupations.
eGivers skew having post-graduate degrees. By comparison, Traditional Givers skew “Some college” and “High school” education. eGivers and Traditional Givers are equally likely to have a 4- year college degree.
88% of eGivers are willing to pay 2% - 4% to cover Church processing fees compared to 51% for Traditional Givers. The percent of eGivers willing to pay the 2% - 4% fee has increased from 81% to 88% since 2023.
“Having more financial stability”, “Seeing the impact of their giving more clearly”, “If the church offered a specific campaign that resonates with churchgoers”, “Encouragement from Church leadership”, and “Having more convenient giving options” would encourage eGivers to contribute more to their Church.
The top-rated reasons for giving are the same for eGivers and Traditional Givers.
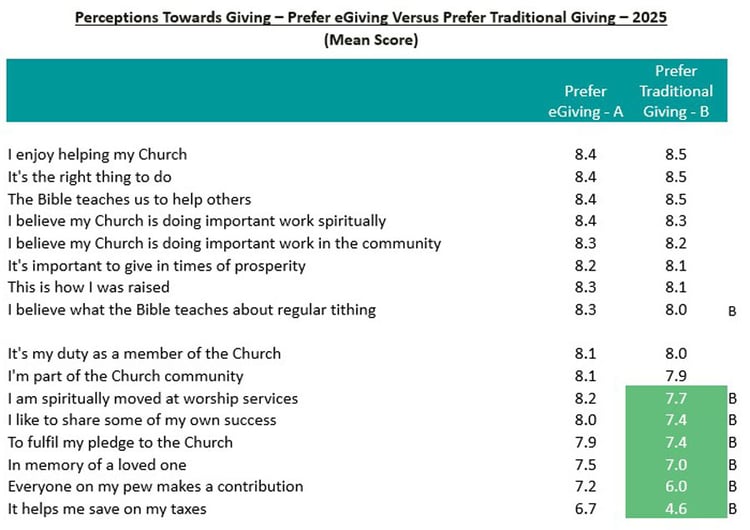
As would be expected, eGivers have more positive perceptions toward eGiving than Traditional Givers.
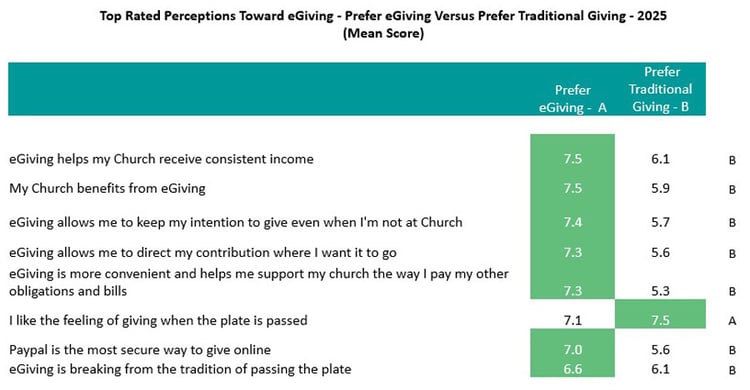
And, Traditional Givers have lower perceptions toward eGiving relative to eGivers.
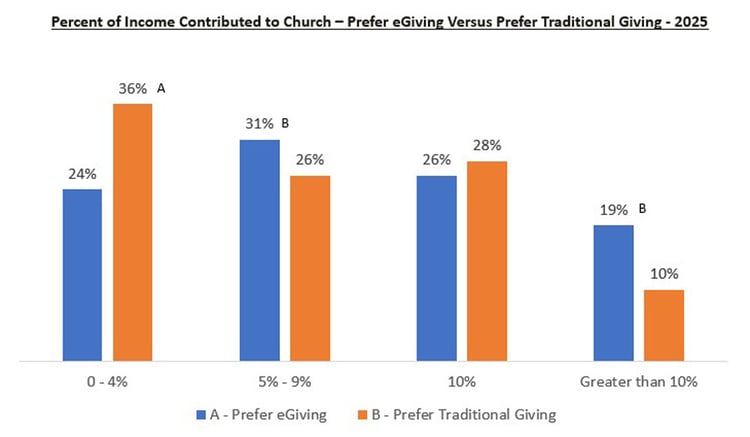
The same percent of eGivers (26%) and Traditional Givers (28%) contribute 10% of their annual salary to their Church.
A larger percentage of eGivers (19%) contributed 11% - 20%+ of their salary than Traditional Givers (10%). Traditional Givers are more likely to give 0% - 6% of their salary to the Church.
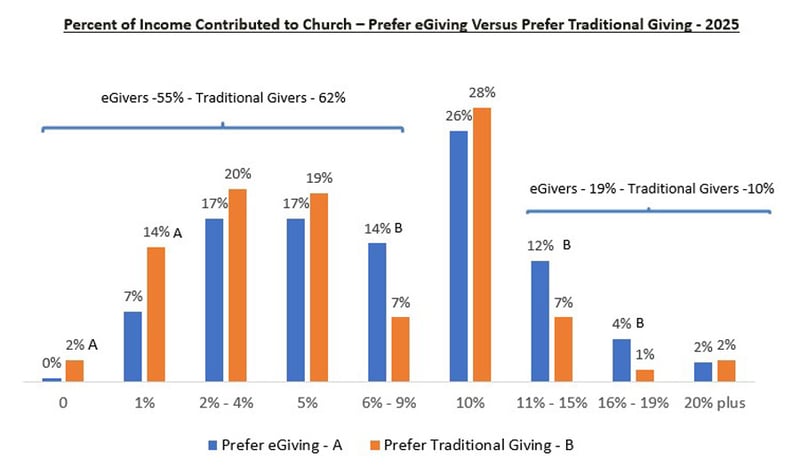
A larger percentage of eGivers give “5% - 9%” and “Greater than 10%” of than annual income compared to Traditional Givers. A larger percentage of Traditional Givers give 0 – 4 % of their income.
eGivers allocate a larger percentage of their contributions to directed funds (42%) versus Traditional Givers (20%).
Three-fourths of eGivers and Traditional Givers make their own contribution decisions. Traditional Givers make weekly contributions more often than eGivers (43% vs 35%). And eGivers are more likely to make contributions monthly vs Traditional Givers. 51% vs 34%)

Giving Behavior: eGivers Versus Traditional Givers
The distinct giving behaviors between eGivers and Traditional Givers offer key insights for churches aiming to enhance member contributions. Our 2025 research highlights significant differences in how these groups approach giving.
Awareness and Use of Contribution Methods
Electronic giving awareness
- eGivers demonstrate higher awareness of electronic giving options available from their churches, including digital payment platforms, mobile apps and online giving solutions.
- Traditional Givers maintain higher familiarity with traditional methods like cash and checks.
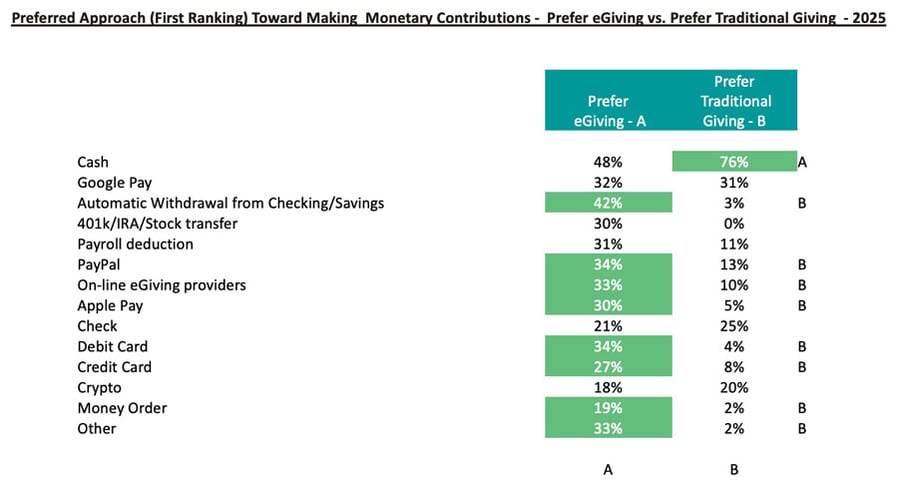
Preferred giving methods
- eGivers strongly prefer digital methods (mobile apps, online giving, recurring electronic payments) when making contributions.
- Traditional Givers predominantly prefer giving via cash or check. However, a notable core group (15–25%) of Traditional Givers is also engaging in digital giving methods, signaling a gradual shift.
Payment Preferences for Church Activities
Ministry payments
- eGivers overwhelmingly favor digital payments for church ministries and activities, aligning with their broader digital lifestyles.
- Traditional Givers primarily prefer cash or checks, though a significant minority is beginning to adopt digital options for convenience.
Digital payment growth
- Digital payments for ministry-related contributions have markedly increased from 2017 to 2025, particularly among younger adults (24–44), reinforcing the ongoing digital transformation within church communities.
Summary and Implications
The clear distinctions between eGivers and Traditional Givers in their giving behaviors suggest targeted strategies churches should consider:
For eGivers
- Offer robust digital giving platforms emphasizing convenience and ease of use.
- Promote structured recurring giving programs to match their giving frequency preferences.
For Traditional Givers
- Continue to provide traditional giving methods while gradually introducing and educating members about digital giving alternatives.
- Highlight the security and simplicity of digital options to facilitate broader adoption.
By recognizing and strategically responding to these behavioral differences, churches can effectively foster higher and more consistent giving across both groups.
A Closer Look at the Data
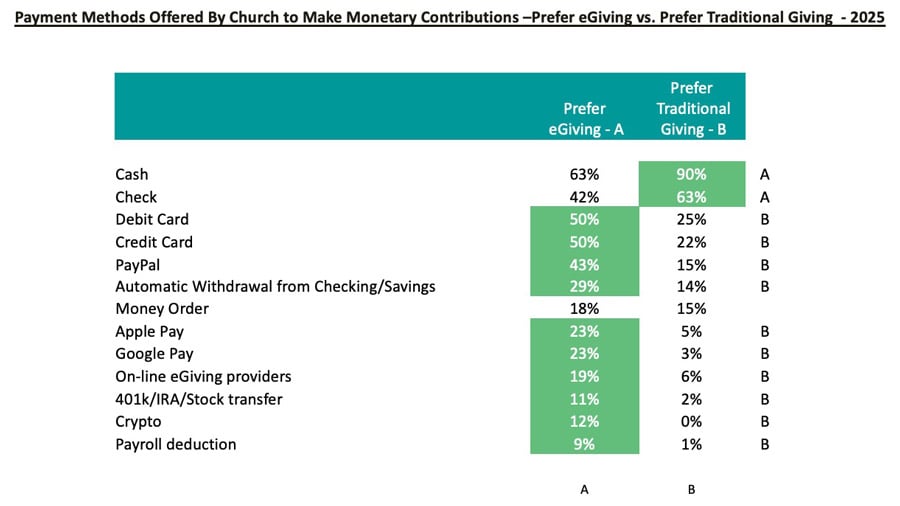
As would be expected, eGivers are more aware of electronic giving options than Traditional Givers.
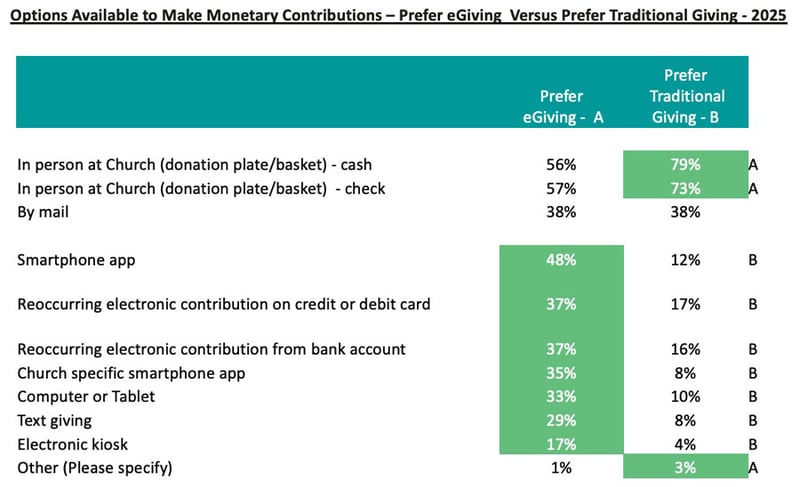
Electronic payment methods have higher awareness among eGivers than Traditional Givers. Traditional Givers are more aware of “Cash” and “Check” giving options.
eGivers prefer to use digital contributions when supporting their Church.
Overall, eGivers prefer to use digital payments for Church ministries, Traditional Givers prefer to use “Cash” or “Check”.
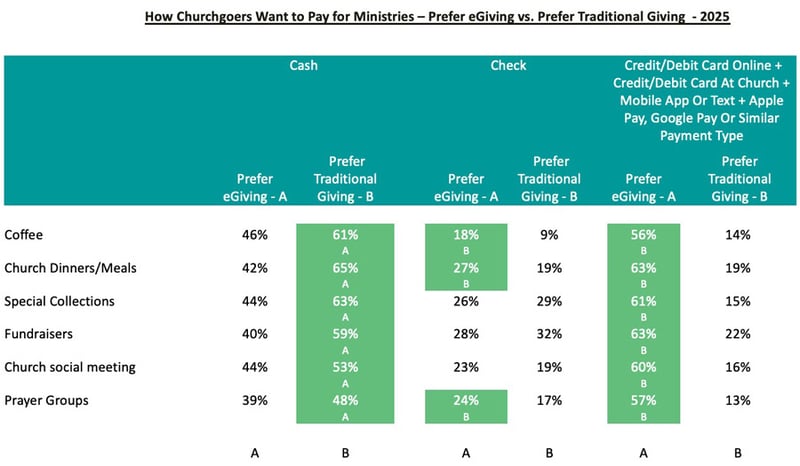
eGivers prefer to use digital payments for Church ministries; Traditional Givers prefer to use Cash. However, a core group of Traditional Givers (15% - 25%) are using digital payments.
Church Activities, Attitudes and Attendance: eGivers Versus Traditional Givers
Distinct differences in attendance patterns, communication preferences and ministry participation between eGivers and Traditional Givers offer essential guidance for churches aiming to strengthen community engagement and attendance.
Attendance Patterns: Virtual and In-Person
In-person attendance
- More than 90% of both eGivers and Traditional Givers attended church in person in 2025, demonstrating continued commitment to traditional worship experiences.
Virtual attendance
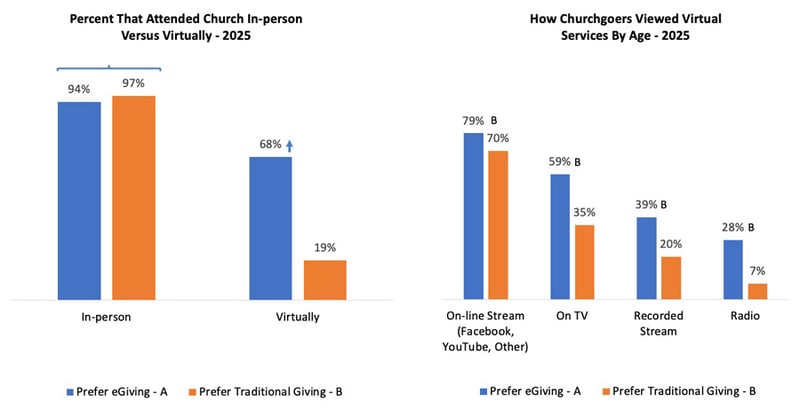
- eGivers are significantly more inclined toward virtual attendance (68%) compared to Traditional Givers (19%).
- Preferred virtual methods for eGivers include online streaming (79%), TV broadcasts (59%), recorded streams (39%) and radio (28%).
Frequency of attendance
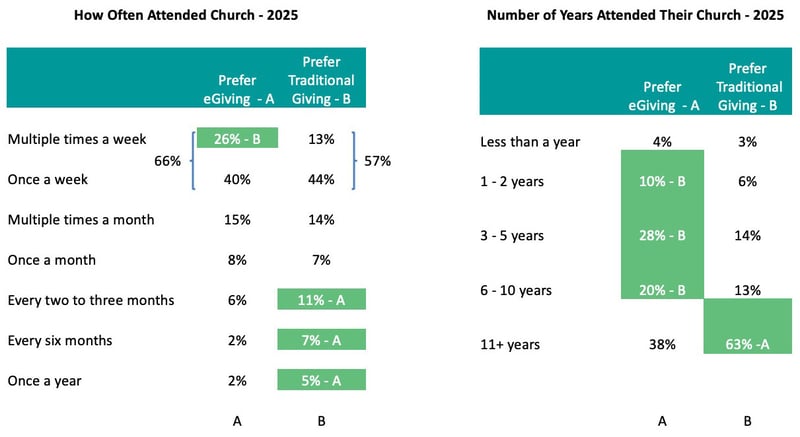
- eGivers attend church services weekly at a higher rate (66%) than Traditional Givers (57%), highlighting deeper ongoing engagement within digital-savvy groups.
Worship Style Preferences
Traditional versus contemporary services
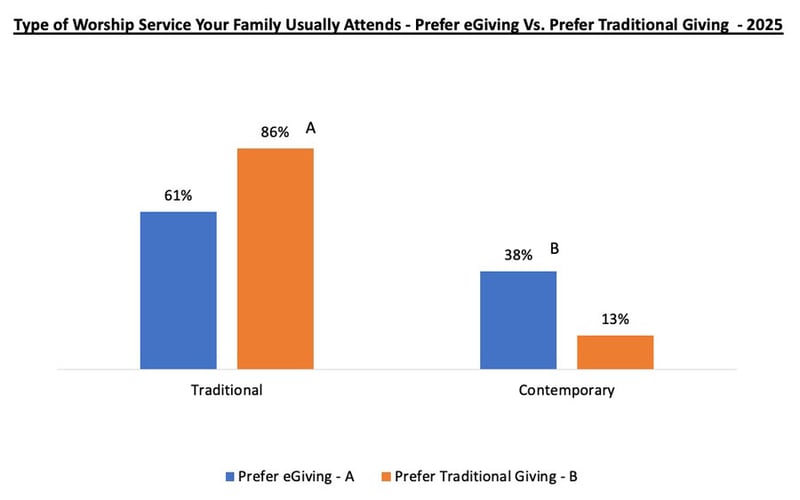
- Traditional Givers predominantly favor traditional worship services (86%).
- eGivers exhibit a stronger preference for contemporary worship (38%), though a notable 61% still attend traditional services.
Tenure and Long-Term Attendance
Church tenure
- Traditional Givers have notably longer tenure, with 63% attending their current churches for 11+ years.
- eGivers demonstrate shorter tenure overall, with 38% attending their current churches for 11+ years.
Satisfaction with Church Communication
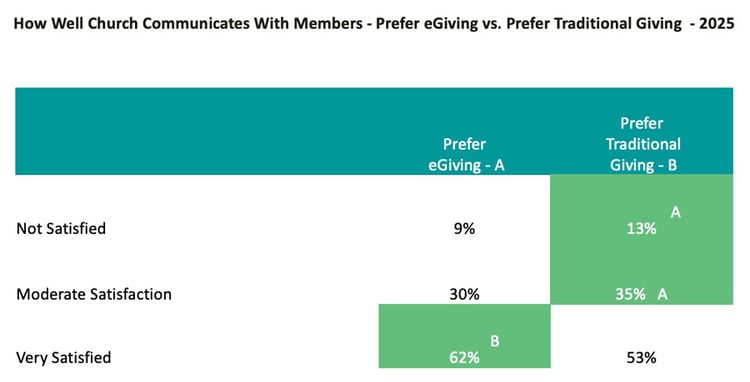
eGivers express higher satisfaction (62 percent) with how their churches communicate with members, compared to Traditional Givers (53 percent).
Communication Preferences
eGivers' preferred channels
- Digital platforms dominate their preferences, including church websites, donation pages, mobile apps, email, social media and text messaging.
Traditional Givers' preferred channels
- Preference remains strong for announcements during services, printed bulletins and mailed letters.
- Traditional channels retain high awareness among this group.
Ministry Participation
Apart from worship attendance, eGivers show higher participation rates in additional church ministries and activities, signaling their broader engagement within their church communities compared to Traditional Givers.
Daily Media Usage Patterns
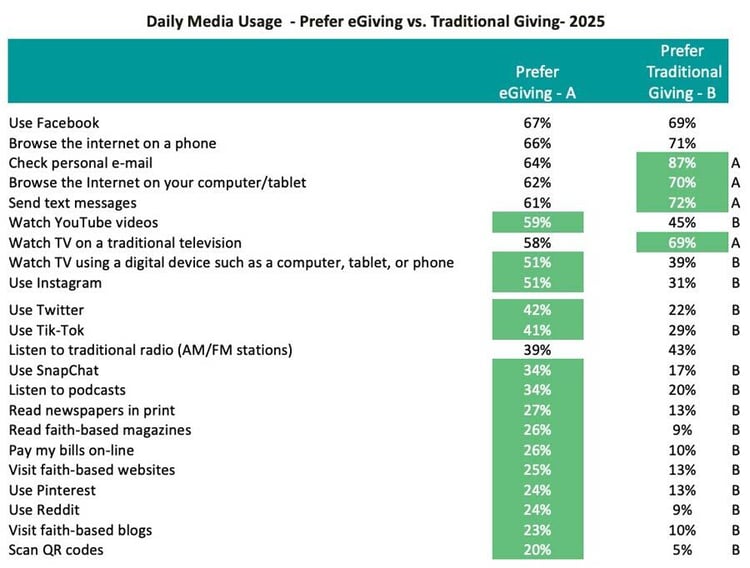
Digital media engagement
- eGivers consistently demonstrate higher daily usage across most digital media platforms.
Traditional communication methods
- Traditional Givers have higher daily engagement with activities like checking emails and sending text messages, reflecting a mix of digital and traditional media usage.
Summary and Strategic Implications
Understanding these distinct behaviors and preferences can help churches meet members where they are.
For eGivers
- Enhance digital communications and invest in online worship experiences to maintain high engagement.
- Offer diverse ministry participation opportunities through digital channels.
For Traditional Givers
- Continue robust traditional communication methods (bulletins, mailed letters, in-service announcements).
- Gradually introduce and support transitions toward digital tools, highlighting ease and convenience.
By strategically aligning ministry efforts and communication methods with these insights, churches can effectively deepen involvement and strengthen relationships across both eGiver and Traditional Giver groups.
Greater than 90% of eGivers and Traditional Givers attended Church in-person in 2025. eGivers (68%) are more likely to attend virtual services compared to Traditional Givers (19%). eGivers use “On-line streaming” (79%), “TV” (59%), “Recorded Stream” (39%), and “Radio” (28%) to attend virtually.
A larger percentage of eGivers attend church weekly than Traditional Givers (66% vs. 57%).
Traditional Givers have longer tenure at their Church compared to eGivers (11+ years – 49% - eGivers; 62% - Traditional Givers)
Traditional Givers are more likely to attend a traditional service than eGivers (86% vs 61%). By comparison, a larger percentage of eGivers attend contemporary services (38% vs 13%).
eGivers are more satisfied with how their Church communicates with members than Traditional Givers (62% versus 53%).
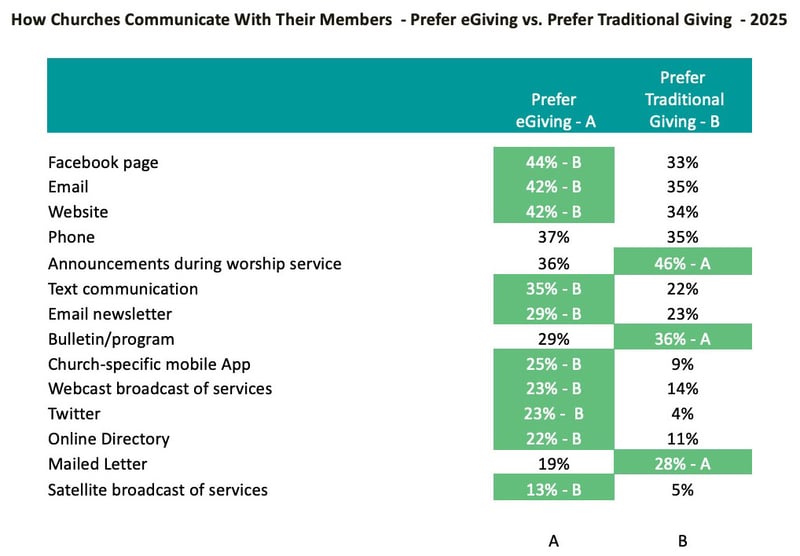
eGivers have higher awareness of most Church communication methods except “Announcement during worship services”, “Bulletin/program”, and “Mailed letter”, where Traditional Givers have higher awareness.
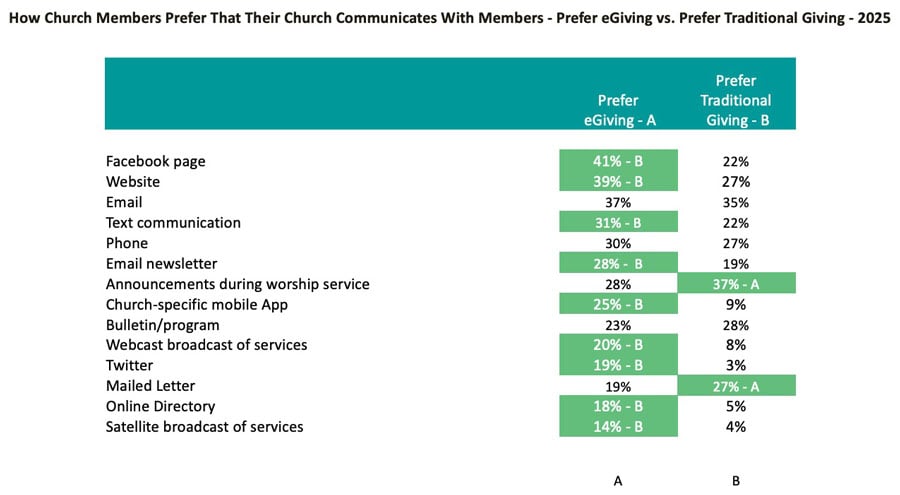
Overall, eGivers prefer digital Church communications whereas Traditional Givers prefer Church communications from “Announcements at worship services”, and “Bulletin/program”.
Except for attending worship services, a larger percentage of eGivers participate in Church ministries than Traditional Givers.
eGivers have higher daily usage rates across most digital media activities compared to Traditional Givers. A larger percentage of Traditional Givers use the “Internet”, “Check”, “e-mail”, and “Send text messages” daily compared to eGivers.
FREE Benchmark Giving Study of 25,000 Churches
See How Your Church Compares
Did you know our benchmark study showed that recurring or automatic givers donated more than twice what nonrecurring givers gave? Discover more valuable insights and see how your church compares to the aggregate giving data of 25,000 churches!
10X Growth in Recurring Giving? Get the Story!
See how CDO Church in National City, California grew its mission by expanding the number of their recurring givers.
Get the StoryThe Vanco Difference is Real — See How We're Changing the Way Organizations Give and Grow!

Trusted by Churches of All Denominations!
![]()
![]()

![]()
25,000 churches use Vanco’s tools to simply tasks, boost engagement and grow online giving by an average of 159%.
|
Looking to Get Started Growing Giving with Vanco? |
|
Still have Questions? Call Us Today! (866-811-7948) |

What Makes 25,000 Churches Trust Vanco for Online Donations?
Discover why 25,000 churches trust Vanco for their online donations. Hear from other churches about their experiences and learn how Vanco's church-focused system provides the perfect solution for managing online giving.


Treasurer Dave
Church finance staff and volunteers love Vanco. Watch now to see why!

Grow Your Church Fast – Boost Engagement, Attract Members - Watch How!
Discover the secret of using church events to boost community engagement, attract new members, and increase giving opportunities! Click to watch and see how.
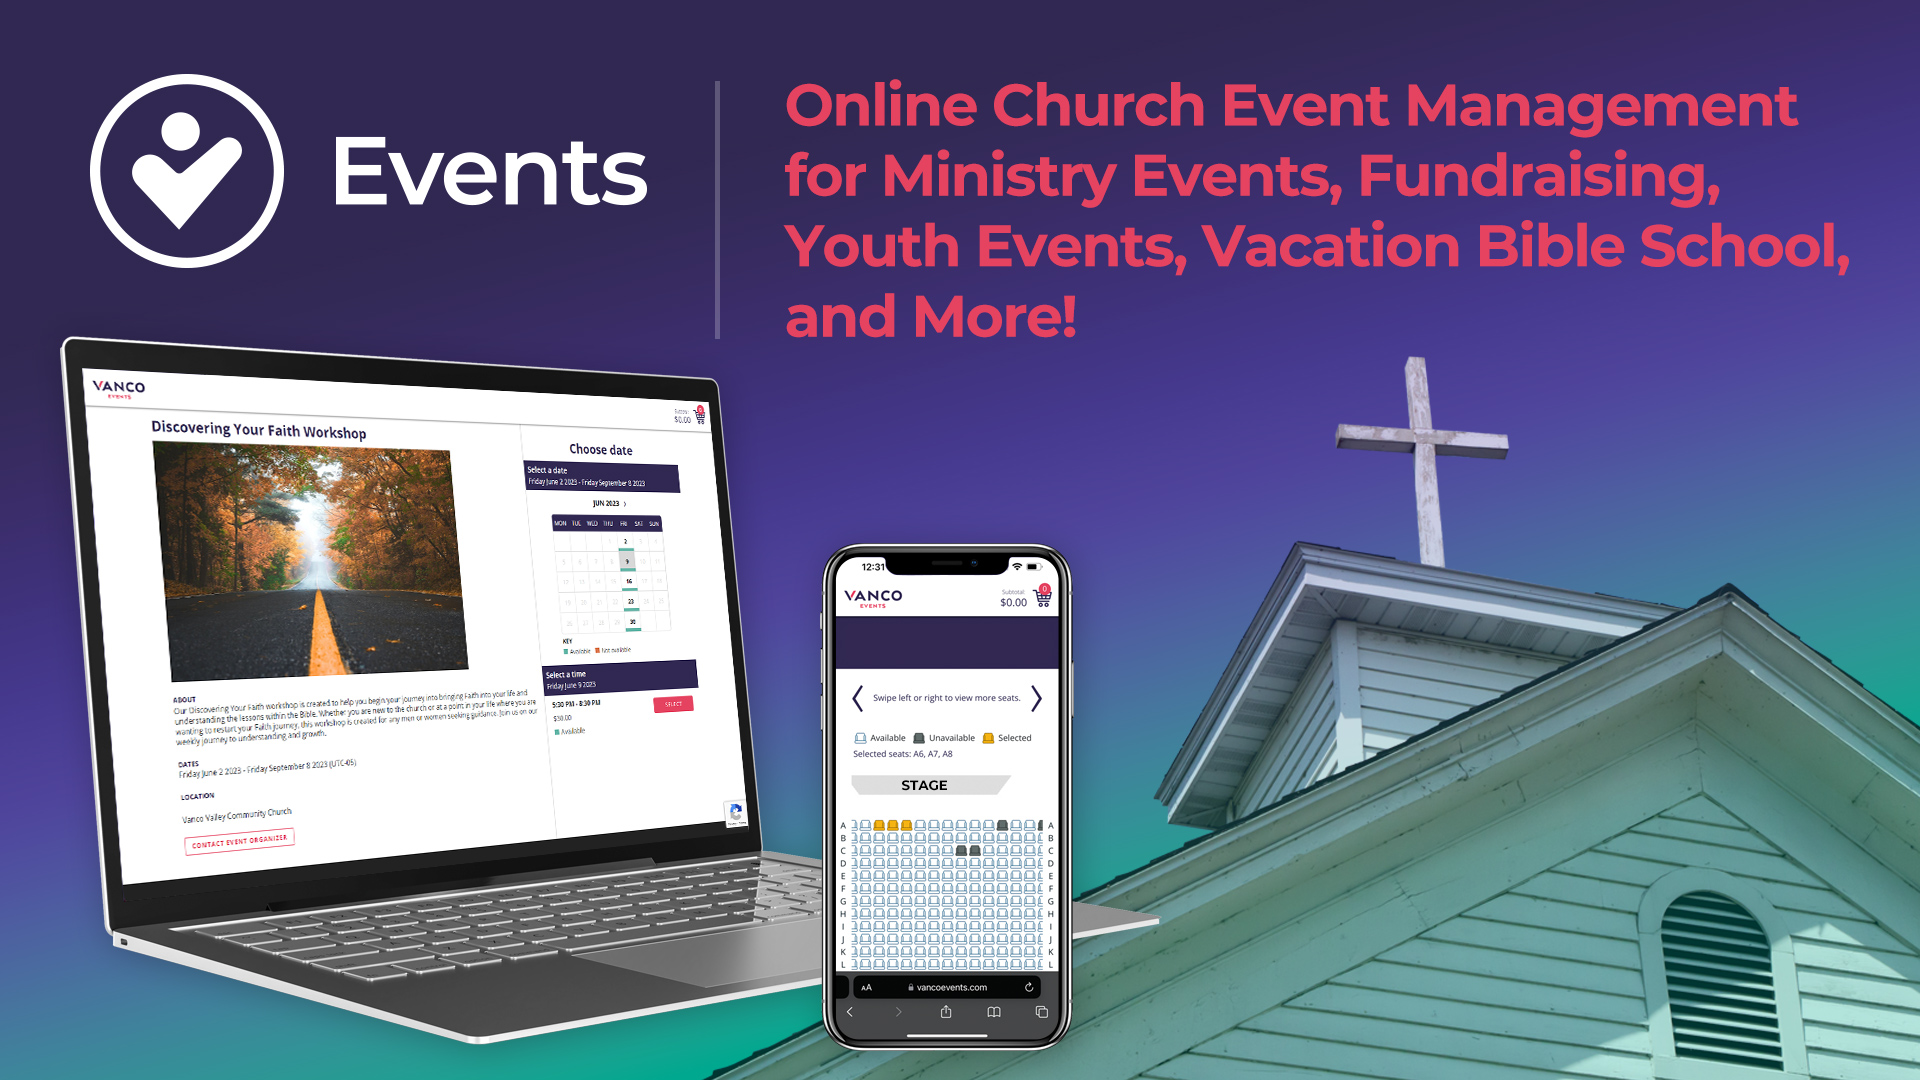
Looking to Get Started with Online Events?
Still have Questions?